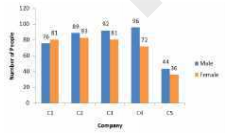
 What is the average number of women working per company ?
 A
B
C
D
Text Solution
Verified by Experts
The correct Answer is:


PINNACLE-DATA INTERPRETATION-EXERCISE
- The bar graph given below shows the number of men and women working in...
Text Solution
|
- The bar graph given below shows the number of men and women working in...
Text Solution
|
- The bar graph given below shows the number of men and women working in...
Text Solution
|
- The pie chart given below presents the percentage of the number of mot...
Text Solution
|
- The pie chart given below presents the percentage of the number of mot...
Text Solution
|
- The pie chart given below presents the percentage of the number of mot...
Text Solution
|
- The Bar graph below presents the amount (volume in litres) of water in...
Text Solution
|
- The Bar graph below presents the amount (volume in litres) of water in...
Text Solution
|
- The Bar graph given below presents the amount (volume in litres) of wa...
Text Solution
|
- The Bar graph shown below presents the number of employees in an offic...
Text Solution
|
- The Bar graph shown below presents the number of employees in an offic...
Text Solution
|
- The Bar graph shown below presents the number of employees in an offic...
Text Solution
|
- The Table given below presents the Rainfall (in mm) in two cities on d...
Text Solution
|
- The Table given below presents the Rainfall (in mm) in two cities on d...
Text Solution
|
- The Table given below presents the Rainfall (in mm) in two cities on d...
Text Solution
|
- The bar graph given below presents the number of books sold by a books...
Text Solution
|
- The bar graph given below presents the number of books sold by a books...
Text Solution
|
- The bar graph given below presents the number of books sold by a books...
Text Solution
|
- The given Pie Chart (central angles are not as per any chosen scale) p...
Text Solution
|
- The given Pie Chart (central angles are not as per any chosen scale) p...
Text Solution
|