 The amount of water in mixture
M7 is how much more than the average amount of water per mixture?
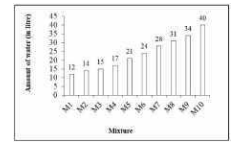
The amount of water in mixture
M7 is how much more than the average amount of water per mixture? A
B
C
D
Text Solution
Verified by Experts


Topper's Solved these Questions
Similar Questions
Explore conceptually related problems
PINNACLE-DATA INTERPRETATION-EXERCISE
- The pie chart given below presents the percentage of the number of mot...
Text Solution
|
- The pie chart given below presents the percentage of the number of mot...
Text Solution
|
- The Bar graph below presents the amount (volume in litres) of water in...
Text Solution
|
- The Bar graph below presents the amount (volume in litres) of water in...
Text Solution
|
- The Bar graph given below presents the amount (volume in litres) of wa...
Text Solution
|
- The Bar graph shown below presents the number of employees in an offic...
Text Solution
|
- The Bar graph shown below presents the number of employees in an offic...
Text Solution
|
- The Bar graph shown below presents the number of employees in an offic...
Text Solution
|
- The Table given below presents the Rainfall (in mm) in two cities on d...
Text Solution
|
- The Table given below presents the Rainfall (in mm) in two cities on d...
Text Solution
|
- The Table given below presents the Rainfall (in mm) in two cities on d...
Text Solution
|
- The bar graph given below presents the number of books sold by a books...
Text Solution
|
- The bar graph given below presents the number of books sold by a books...
Text Solution
|
- The bar graph given below presents the number of books sold by a books...
Text Solution
|
- The given Pie Chart (central angles are not as per any chosen scale) p...
Text Solution
|
- The given Pie Chart (central angles are not as per any chosen scale) p...
Text Solution
|
- The given Pie Chart (central angles are not as per any chosen scale) p...
Text Solution
|
- The Bar graph given below presents the number of shoes manufactured by...
Text Solution
|
- The Bar graph given below presents the number of shoes manufactured by...
Text Solution
|
- The Bar graph given below presents the number of shoes manufactured by...
Text Solution
|