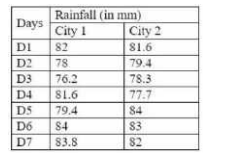
 What is the difference (correct up to two decimal places) in average rainfall in two cities per day?
 A
B
C
D
Text Solution
Verified by Experts


Topper's Solved these Questions
Similar Questions
Explore conceptually related problems
PINNACLE-DATA INTERPRETATION-EXERCISE
- The Bar graph shown below presents the number of employees in an offic...
Text Solution
|
- The Table given below presents the Rainfall (in mm) in two cities on d...
Text Solution
|
- The Table given below presents the Rainfall (in mm) in two cities on d...
Text Solution
|
- The Table given below presents the Rainfall (in mm) in two cities on d...
Text Solution
|
- The bar graph given below presents the number of books sold by a books...
Text Solution
|
- The bar graph given below presents the number of books sold by a books...
Text Solution
|
- The bar graph given below presents the number of books sold by a books...
Text Solution
|
- The given Pie Chart (central angles are not as per any chosen scale) p...
Text Solution
|
- The given Pie Chart (central angles are not as per any chosen scale) p...
Text Solution
|
- The given Pie Chart (central angles are not as per any chosen scale) p...
Text Solution
|
- The Bar graph given below presents the number of shoes manufactured by...
Text Solution
|
- The Bar graph given below presents the number of shoes manufactured by...
Text Solution
|
- The Bar graph given below presents the number of shoes manufactured by...
Text Solution
|
- The Table shows the number of T-20 matches played, runs scored, 50s an...
Text Solution
|
- The Table shows the number of T-20 matches played, runs scored, 50s an...
Text Solution
|
- The Table shows the number of T-20 matches played, runs scored, 50s an...
Text Solution
|
- The Bar Graph shows the Profit (Rupees in Lakhs) earned by two compani...
Text Solution
|
- The Bar Graph shows the Profit (Rupees in Lakhs) earned by two compani...
Text Solution
|
- The Bar Graph shows the Profit (Rupees in Lakhs) earned by two compani...
Text Solution
|
- The given bar graph shows the production and sale of mobile handsets o...
Text Solution
|