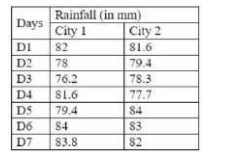
 If the data of Rainfall of City 1 is represented through a Pie chart, then what will be the central
angle (nearest to 0.1 degree) corresponding to D1?
If the data of Rainfall of City 1 is represented through a Pie chart, then what will be the central
angle (nearest to 0.1 degree) corresponding to D1? A
B
C
D
Text Solution
Verified by Experts


PINNACLE-DATA INTERPRETATION-EXERCISE
- The Table given below presents the Rainfall (in mm) in two cities on d...
Text Solution
|
- The Table given below presents the Rainfall (in mm) in two cities on d...
Text Solution
|
- The Table given below presents the Rainfall (in mm) in two cities on d...
Text Solution
|
- The bar graph given below presents the number of books sold by a books...
Text Solution
|
- The bar graph given below presents the number of books sold by a books...
Text Solution
|
- The bar graph given below presents the number of books sold by a books...
Text Solution
|
- The given Pie Chart (central angles are not as per any chosen scale) p...
Text Solution
|
- The given Pie Chart (central angles are not as per any chosen scale) p...
Text Solution
|
- The given Pie Chart (central angles are not as per any chosen scale) p...
Text Solution
|
- The Bar graph given below presents the number of shoes manufactured by...
Text Solution
|
- The Bar graph given below presents the number of shoes manufactured by...
Text Solution
|
- The Bar graph given below presents the number of shoes manufactured by...
Text Solution
|
- The Table shows the number of T-20 matches played, runs scored, 50s an...
Text Solution
|
- The Table shows the number of T-20 matches played, runs scored, 50s an...
Text Solution
|
- The Table shows the number of T-20 matches played, runs scored, 50s an...
Text Solution
|
- The Bar Graph shows the Profit (Rupees in Lakhs) earned by two compani...
Text Solution
|
- The Bar Graph shows the Profit (Rupees in Lakhs) earned by two compani...
Text Solution
|
- The Bar Graph shows the Profit (Rupees in Lakhs) earned by two compani...
Text Solution
|
- The given bar graph shows the production and sale of mobile handsets o...
Text Solution
|
- Identify A,B,C,D and E in the given diagram of arrangement of teeth
Text Solution
|