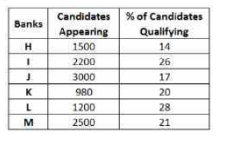
 What was the average number of candidates appeared in the interview for Banks H, J and L
taken together ?
What was the average number of candidates appeared in the interview for Banks H, J and L
taken together ? A
B
C
D
Text Solution
Verified by Experts


PINNACLE-DATA INTERPRETATION-EXERCISE
- The given bar graph shows the production and sale of mobile handsets o...
Text Solution
|
- The table shows the number of candidates appearing in the interview fo...
Text Solution
|
- The table shows the number of candidates appearing in the interview fo...
Text Solution
|
- The table shows the number of candidates appearing in the interview fo...
Text Solution
|
- The Table shows the Number of Laptops and Desktops manufactured by a c...
Text Solution
|
- The Table shows the Number of Laptops and Desktops manufactured by a c...
Text Solution
|
- The Table shows the Number of Laptops and Desktops manufactured by a c...
Text Solution
|
- The Table shows the number of articles sold by six different sellers (...
Text Solution
|
- The Table shows the number of articles sold by six different sellers (...
Text Solution
|
- The Table shows the number of articles sold by six different sellers (...
Text Solution
|
- The Table shows the distribution of the marks obtained by various stud...
Text Solution
|
- The Pie chart shows the proportionate population of seven villages. Th...
Text Solution
|
- The bar chart shows the annual food grain production (in million tonne...
Text Solution
|
- The Pie Chart shows the angular representation of five different Emplo...
Text Solution
|
- The Pie Chart shows the angular representation of five different Emplo...
Text Solution
|
- The Pie Chart shows the angular representation of five different Emplo...
Text Solution
|
- The Table given below presents the annual expenses (in thousands) on v...
Text Solution
|
- The Bar graph given below presents the runs scored by eleven cricketer...
Text Solution
|
- What is a density bottle?
Text Solution
|
- The pie-chart specifically shows the allocation of revenue for the exp...
Text Solution
|