 Approximately what was the percentage decrease in number of desktops manufactured in 2012
from 2011? (correct to nearest integer)
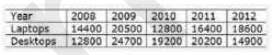
Approximately what was the percentage decrease in number of desktops manufactured in 2012
from 2011? (correct to nearest integer) A
B
C
D
Text Solution
Verified by Experts


PINNACLE-DATA INTERPRETATION-EXERCISE
- The table shows the number of candidates appearing in the interview fo...
Text Solution
|
- The Table shows the Number of Laptops and Desktops manufactured by a c...
Text Solution
|
- The Table shows the Number of Laptops and Desktops manufactured by a c...
Text Solution
|
- The Table shows the Number of Laptops and Desktops manufactured by a c...
Text Solution
|
- The Table shows the number of articles sold by six different sellers (...
Text Solution
|
- The Table shows the number of articles sold by six different sellers (...
Text Solution
|
- The Table shows the number of articles sold by six different sellers (...
Text Solution
|
- The Table shows the distribution of the marks obtained by various stud...
Text Solution
|
- The Pie chart shows the proportionate population of seven villages. Th...
Text Solution
|
- The bar chart shows the annual food grain production (in million tonne...
Text Solution
|
- The Pie Chart shows the angular representation of five different Emplo...
Text Solution
|
- The Pie Chart shows the angular representation of five different Emplo...
Text Solution
|
- The Pie Chart shows the angular representation of five different Emplo...
Text Solution
|
- The Table given below presents the annual expenses (in thousands) on v...
Text Solution
|
- The Bar graph given below presents the runs scored by eleven cricketer...
Text Solution
|
- What is a density bottle?
Text Solution
|
- The pie-chart specifically shows the allocation of revenue for the exp...
Text Solution
|
- The following pie-chart shows the market share of exporting countries....
Text Solution
|
- The following bar graph shows the quantity (in million) of grains expo...
Text Solution
|
- The bar graph given below shows the wheat production (in tonnes) of a ...
Text Solution
|