Home
Class 14
MATHS
The Bar graph given below presents the r...

The Bar graph given below presents the runs scored by eleven cricketers, named P1, P2, P3, P4, … P11 in their respective careers which lasted for five years in each case. Which cricketer bridges the gap between the highest and the lowest scorers of runs?
नीचे दिया गया दंड आरेख ग्यारह क्रिकेटरों - P1, P2, P3, P4…… P11 के द्वारा उनके अपने करियर में बनाये गए रनों को दर्शाता है जो हर मामले में पांच साल का रहा है | सबसे अधिक एवं सबसे कम रन बनाने वाले बललेबाज़ों के बीच की खाई कौन सा क्रिकेटर भरता है ?

A

P8

B

P6

C

P10

D

P3

Text Solution

Verified by Experts

Promotional Banner

Topper's Solved these Questions

Similar Questions

Explore conceptually related problems

The Bar graph given below opresents the runs scored by eleven cricketers, named P1,P2,P3,P4 ….P11 in their respective careers which lasted for years in each case. Which cricketer bridges the gap between the highest and the lowest scorers of runs ?

P1 and P2 are respectively :

The pie chart given below shows the imports of 7 different items P1, P2, P3, P4, PS, P6 and P7 as a percentage of total imports of a country. If the total import of item P1 is ₹ 33000, then what is the value of imports of item P2?

A prime number p is called special if there exist primes P_1, P_2, P_3, P_4 such that P=P_1+P_2=P_3-P_4 . The number of special primes is

If p1,p2,p3 are respectively the perpendicular from the vertices of a triangle to the opposite sides,then find the value of p1p2p3

The line chart given below show the profit percentage of a company on 5 different products P1, P2, P3, P4 and P5. The revenue of product P3 is 38100. What is expenditure of product P3 ?

Find the value of p for which the numbers 2p-1, 3p+1, 11 are in AP. Hence, find the numbers.

Six phones P1, P2, P3, P4, P5 and P6 are placed in a row facing towards north (Not necessarily in the same order). P1 is placed to the immediate left of P6. P5 is placed second to the left of P2. P4 is placed second to the right of P6. P4 is to the immediate right of P5. P3 is towards the left of P1. How many phones are placed between P3 and P6? छः फ़ोन - - P1, P2, P3, P4, P5 और P6 एक पंक्ति में उत्तर की ओर ,मुख करके रखे गए हैं लेकिन ज़रूरी नहीं कि इसी क्रम में |P1 को P6 के तुरंत बाएं को रखा गया है | P5 को P2 के बाएं को दूसरे स्थान पर रखा गया है | P4 को P6 के दायें को दूसरे स्थान पर रखा गया है | P4, P5 के तुरंत दायें को है | P3, P1 के बायीं ओर है | P3 और P6 के बीच कितने फ़ोन रखे गए हैं ?

PINNACLE-DATA INTERPRETATION-EXERCISE
  1. The Pie Chart shows the angular representation of five different Emplo...

    Text Solution

    |

  2. The Table given below presents the annual expenses (in thousands) on v...

    Text Solution

    |

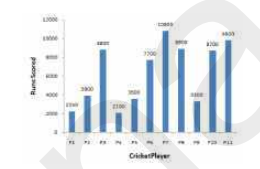
  3. The Bar graph given below presents the runs scored by eleven cricketer...

    Text Solution

    |

  4. What is a density bottle?

    Text Solution

    |

  5. The pie-chart specifically shows the allocation of revenue for the exp...

    Text Solution

    |

  6. The following pie-chart shows the market share of exporting countries....

    Text Solution

    |

  7. The following bar graph shows the quantity (in million) of grains expo...

    Text Solution

    |

  8. The bar graph given below shows the wheat production (in tonnes) of a ...

    Text Solution

    |

  9. The bar graph given below shows the profit (in multiples of thousand r...

    Text Solution

    |

  10. The Table presents the amount of milk (in litres) sold by two milkmen ...

    Text Solution

    |

  11. The Table presents the amount of milk (in litres) sold by two milkmen ...

    Text Solution

    |

  12. The Table presents the amount of milk (in litres) sold by two milkmen ...

    Text Solution

    |

  13. The pie-chart given below shows the number of laptops in an office pro...

    Text Solution

    |

  14. The pie-chart given below shows the expenses incurred by various depar...

    Text Solution

    |

  15. The pie-chart given below shows the expenses incurred by various depar...

    Text Solution

    |

  16. The given Bar Graph presents the Export of Tea and Coffee (in million ...

    Text Solution

    |

  17. The given Bar Graph presents the Export of Tea and Coffee (in million ...

    Text Solution

    |

  18. The given Bar Graph presents the Export of Tea and Coffee (in million ...

    Text Solution

    |

  19. The given Bar Graph presents Income and Expenditure (in crores of Rupe...

    Text Solution

    |

  20. The table given below shows the number of units of a product produced ...

    Text Solution

    |