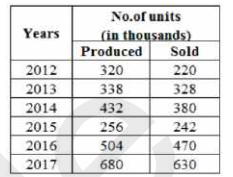
 Find the ratio of the total number of units sold in 2013 and 2015 to the number of units produced in
2015 and 2016?
Find the ratio of the total number of units sold in 2013 and 2015 to the number of units produced in
2015 and 2016? A
B
C
D
Text Solution
Verified by Experts


PINNACLE-DATA INTERPRETATION-EXERCISE
- The given Bar Graph presents the Export of Tea and Coffee (in million ...
Text Solution
|
- The given Bar Graph presents Income and Expenditure (in crores of Rupe...
Text Solution
|
- The table given below shows the number of units of a product produced ...
Text Solution
|
- The table given below shows the number of units of a product produced ...
Text Solution
|
- The table given below shows the number of units of a product produced ...
Text Solution
|
- The pie-chart below shows the percentage figures of eggs consumed in t...
Text Solution
|
- The Pie-chart given below shows the figures of various heads of expend...
Text Solution
|
- The Pie chart given below presents the figures of different heads of e...
Text Solution
|
- The Pie-chart given here shows the percentage of candidates selected i...
Text Solution
|
- The Pie-chart given here shows the percentage of candidates selected i...
Text Solution
|
- The Pie-chart given here shows the percentage of candidates selected i...
Text Solution
|
- The table given below shows the number of notes of three different den...
Text Solution
|
- The table given below shows the number of notes of three different den...
Text Solution
|
- The table given below shows the number of notes of three different den...
Text Solution
|
- The bar graph given below shows the target and actual production of ce...
Text Solution
|
- The bar graph given below shows the target and actual production of ce...
Text Solution
|
- The bar graph given below shows the target and actual production of ce...
Text Solution
|
- The table given below presents the figures of the production (in thous...
Text Solution
|
- The table given below presents the figures of the production (in thous...
Text Solution
|
- The table given below presents the figures of the production (in thous...
Text Solution
|