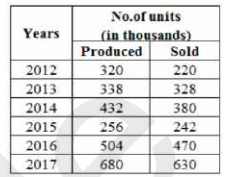
 The number of units sold in 2016 is approximately what percent more than the average number of
units produced from 2012 to 2016?
The number of units sold in 2016 is approximately what percent more than the average number of
units produced from 2012 to 2016? A
B
C
D
Text Solution
Verified by Experts


PINNACLE-DATA INTERPRETATION-EXERCISE
- The given Bar Graph presents Income and Expenditure (in crores of Rupe...
Text Solution
|
- The table given below shows the number of units of a product produced ...
Text Solution
|
- The table given below shows the number of units of a product produced ...
Text Solution
|
- The table given below shows the number of units of a product produced ...
Text Solution
|
- The pie-chart below shows the percentage figures of eggs consumed in t...
Text Solution
|
- The Pie-chart given below shows the figures of various heads of expend...
Text Solution
|
- The Pie chart given below presents the figures of different heads of e...
Text Solution
|
- The Pie-chart given here shows the percentage of candidates selected i...
Text Solution
|
- The Pie-chart given here shows the percentage of candidates selected i...
Text Solution
|
- The Pie-chart given here shows the percentage of candidates selected i...
Text Solution
|
- The table given below shows the number of notes of three different den...
Text Solution
|
- The table given below shows the number of notes of three different den...
Text Solution
|
- The table given below shows the number of notes of three different den...
Text Solution
|
- The bar graph given below shows the target and actual production of ce...
Text Solution
|
- The bar graph given below shows the target and actual production of ce...
Text Solution
|
- The bar graph given below shows the target and actual production of ce...
Text Solution
|
- The table given below presents the figures of the production (in thous...
Text Solution
|
- The table given below presents the figures of the production (in thous...
Text Solution
|
- The table given below presents the figures of the production (in thous...
Text Solution
|
- The given pie Chart (angles are not as per chosen scale) presents the ...
Text Solution
|