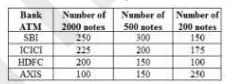
 What is the ratio between the total amount of 500
denominations in ICICI Bank ATM and the total amount of 200 denominations in ICICI Bank ATMs?
What is the ratio between the total amount of 500
denominations in ICICI Bank ATM and the total amount of 200 denominations in ICICI Bank ATMs? A
B
C
D
Text Solution
Verified by Experts


PINNACLE-DATA INTERPRETATION-EXERCISE
- The table given below shows the number of notes of three different den...
Text Solution
|
- The table given below shows the number of notes of three different den...
Text Solution
|
- The table given below shows the number of notes of three different den...
Text Solution
|
- The bar graph given below shows the target and actual production of ce...
Text Solution
|
- The bar graph given below shows the target and actual production of ce...
Text Solution
|
- The bar graph given below shows the target and actual production of ce...
Text Solution
|
- The table given below presents the figures of the production (in thous...
Text Solution
|
- The table given below presents the figures of the production (in thous...
Text Solution
|
- The table given below presents the figures of the production (in thous...
Text Solution
|
- The given pie Chart (angles are not as per chosen scale) presents the ...
Text Solution
|
- The given pie Chart (angles are not as per chosen scale) presents the ...
Text Solution
|
- The given pie Chart (angles are not as per chosen scale) presents the ...
Text Solution
|
- The given Bar Graph presents the number of different types of vehicles...
Text Solution
|
- The given Bar Graph presents the number of different types of vehicles...
Text Solution
|
- The given Bar Graph presents the number of different types of vehicles...
Text Solution
|
- The following bar graph shows the amount of imports (in million kg) of...
Text Solution
|
- The following pie-chart shows the monthly expenditure of a family on v...
Text Solution
|
- The Table shows the number of students from different schools playing ...
Text Solution
|
- The Table shows the number of students from different schools playing ...
Text Solution
|
- The Table shows the number of students from different schools playing ...
Text Solution
|