A
B
C
D
Text Solution
Verified by Experts


PINNACLE-DATA INTERPRETATION-EXERCISE
- The table given below shows the number of notes of three different den...
Text Solution
|
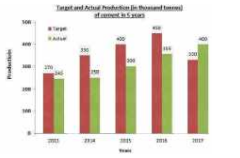
- The bar graph given below shows the target and actual production of ce...
Text Solution
|
- The bar graph given below shows the target and actual production of ce...
Text Solution
|
- The bar graph given below shows the target and actual production of ce...
Text Solution
|
- The table given below presents the figures of the production (in thous...
Text Solution
|
- The table given below presents the figures of the production (in thous...
Text Solution
|
- The table given below presents the figures of the production (in thous...
Text Solution
|
- The given pie Chart (angles are not as per chosen scale) presents the ...
Text Solution
|
- The given pie Chart (angles are not as per chosen scale) presents the ...
Text Solution
|
- The given pie Chart (angles are not as per chosen scale) presents the ...
Text Solution
|
- The given Bar Graph presents the number of different types of vehicles...
Text Solution
|
- The given Bar Graph presents the number of different types of vehicles...
Text Solution
|
- The given Bar Graph presents the number of different types of vehicles...
Text Solution
|
- The following bar graph shows the amount of imports (in million kg) of...
Text Solution
|
- The following pie-chart shows the monthly expenditure of a family on v...
Text Solution
|
- The Table shows the number of students from different schools playing ...
Text Solution
|
- The Table shows the number of students from different schools playing ...
Text Solution
|
- The Table shows the number of students from different schools playing ...
Text Solution
|
- The Table shows the number of students from different schools playing ...
Text Solution
|
- A book has been co-authored by X and Y. The prices of the book in Indi...
Text Solution
|