Home
Class 14
MATHS
The following pie-chart shows the monthl...

The following pie-chart shows the monthly expenditure of a family on various items. If the family spends Rs. 825 on clothing, answer the question

What is the total monthly income of the family?

A

Rs 1,08,000 / रु 1,08,000

B

Rs 72,000 / रु 72,000

C

Rs 90000 / रु 90000

D

Rs 36000 /रु 36,000

Text Solution

Verified by Experts

Promotional Banner

Topper's Solved these Questions

Similar Questions

Explore conceptually related problems

The following pie-chart shows the monthly expenditure of a family on various items. If the family spends Rs. 825 on clothing, answer the question What percent of the total income does the family save ?

Following table shows the monthly expenditure of Imrans family on various items.

The following pie-chart shows the monthly expenditure of a family on various items. If the family spends Rs. 825 on clothing, answer the question What is the average of expenses on clothing and rent?

The following pie-chart shows the monthly expenditure of a family on various items. If the family spends Rs. 825 on clothing, answer the question. निम्नलिखित पाई-चार्ट में किसी परिवार के विभिन्न मदों पर होने वाले खर्च का दर्शाया गया है। यदि परिवार वस्त्रों पर 825 रू खर्च करे तो प्रश्न का उत्तर दीजिए। What is the total monthly income of the family? परिवार की कुल मासिक आय कितनी है?

The following pie-chart shows the monthly expenditure of a family on various items. If the family spends Rs. 825 on clothing, answer the question. निम्नलिखित पाई-चार्ट में किसी परिवार के विभिन्न मदों पर होने वाले खर्च का दर्शाया गया है। यदि परिवार वस्त्रों पर 825 रू खर्च करे तो प्रश्न का उत्तर दीजिए। What percent of the total income does the family save? परिवार में कुल आय को कितनी प्रतिशत राशि की बचत की जाती है?

The following pe chart shows the monthly expenditure of a family on various items. If the family spends Rs. 825 on clothing, answer the question. निम्नलिखित पाई-चार्ट में किसी परिवार के विभिन्न मदों पर होने वाले खर्च का दर्शाया गया है। यदि परिवार वस्त्रों पर 825 रू खर्च करे तो प्रश्न का उत्तर दीजिए। What is the average of expenses on clothing and rent? वस्त्रों और किराये पर खर्च होने वाली औसत राशि बताएं ?

The following pie-chart shows the monthly expenditure of a man on various items. If he spends Rs. 16,000 per month, answer the following questions. The amount he spends on education is:

The following pie-chart shows the monthly expenditure of a man on various items. If he spends Rs. 16,000 per month, answer the following questions. The ratio of expenses on food and rent is :

The following pie-chart shows the monthly expenditure of a man on various items. If he spends Rs. 16,000 per month, answer the following questions. If miscellaneous expenses be x% of the total expense, then value of x is:

The following pie-chart shows the monthly expenditure of a man on various items. If he spends Rs. 16,000 per month, answer the following questions. How much more does he spend on rent as compared to education ?

PINNACLE-DATA INTERPRETATION-EXERCISE
  1. The given Bar Graph presents the number of different types of vehicles...

    Text Solution

    |

  2. The following bar graph shows the amount of imports (in million kg) of...

    Text Solution

    |

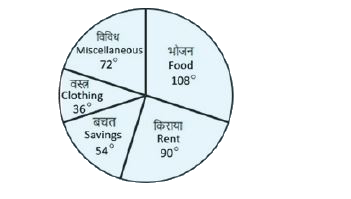
  3. The following pie-chart shows the monthly expenditure of a family on v...

    Text Solution

    |

  4. The Table shows the number of students from different schools playing ...

    Text Solution

    |

  5. The Table shows the number of students from different schools playing ...

    Text Solution

    |

  6. The Table shows the number of students from different schools playing ...

    Text Solution

    |

  7. The Table shows the number of students from different schools playing ...

    Text Solution

    |

  8. A book has been co-authored by X and Y. The prices of the book in Indi...

    Text Solution

    |

  9. A book has been co-authored by X and Y. The prices of the book in Indi...

    Text Solution

    |

  10. A book has been co-authored by X and Y. The prices of the book in Indi...

    Text Solution

    |

  11. The Pie chart given below presents the projected revenue and various e...

    Text Solution

    |

  12. The given table shows the number (in thousands) of cars of five differ...

    Text Solution

    |

  13. The given table shows the number (in thousands) of cars of five differ...

    Text Solution

    |

  14. The given table shows the number (in thousands) of cars of five differ...

    Text Solution

    |

  15. The given table shows the number (in thousands) of cars of five differ...

    Text Solution

    |

  16. The given table represents the number of engineers recruited by four c...

    Text Solution

    |

  17. The given table represents the number of engineers recruited by four c...

    Text Solution

    |

  18. The given table represents the number of engineers recruited by four c...

    Text Solution

    |

  19. The given table represents the number of engineers recruited by four c...

    Text Solution

    |

  20. The number of students enrolled in different faculties in a school is ...

    Text Solution

    |