Home
Class 14
MATHS
The Table shows the number of students f...

The Table shows the number of students from different schools playing different games.
यह तालिका अलग-अलग विद्यालयों के छात्रों की संख्या को दर्शाती है जो अलग-अलग खेल खेलते हैं ?
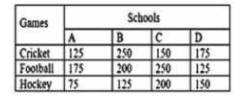
What is the average of the number of students who play cricket in all four schools?
सभी चार विद्यालयों में क्रिकेट खेलने है छात्रों की औसत संख्या कितनी

A

180

B

200

C

190

D

175

Text Solution

Verified by Experts

Promotional Banner

Topper's Solved these Questions

Similar Questions

Explore conceptually related problems

The Table shows the number of students from different schools playing different games. यह तालिका अलग-अलग विद्यालयों के छात्रों की संख्या को दर्शाती है जो अलग-अलग खेल खेलते हैं ? What is the ratio of the total students who play cricket in schools A and B together to the total students who play hockey in schools C and D ? विद्यालय A और B में क्रिकेट खेलने वाले छात्रों की कुल संख्या का विद्यालय C और D में हॉकी खेलने वाले छात्रों की कुल संख्या के साथ क्या अनुपात है ?

The Table shows the number of students from different schools playing different games. यह तालिका अलग-अलग विद्यालयों के छात्रों की संख्या को दर्शाती है जो अलग-अलग खेल खेलते हैं ? The number of students who play football in school A is approximately what percent of the football playing students from all schools? विद्यालय A में फुटबॉल खेलने वाले छात्रों की संख्या सभी विद्यालयों में फुटबॉल खेलने वाले छात्रों की संख्या का लगभग कितना प्रतिशत है ?

The Table shows the number of students from different schools playing different games. यह तालिका अलग-अलग विद्यालयों के छात्रों की संख्या को दर्शाती है जो अलग-अलग खेल खेलते हैं ? If the data about the number of students who play hockey from different schools is represented by a pie-chart, what is the central angle of the sector representing students who play hockey from school C to the nearest whole number? यदि अलग-अलग विद्यालयों में हॉकी खेलने वाले छात्रों से संबंधित आंकड़ों को एक पाई-चार्ट में प्रस्तुत किया जाए, तो विद्यालय C में हॉकी खेलने वाले छात्रों को दर्शने वाले खंड का केंद्रीय कोण ( निकटतम पूर्ण संख्या में ) क्या होगा ?

The table given below shows the number of students having obtained different marks नीचे दी गयी तालिका अलग-अलग अंक प्राप्त करने वाले छात्रों की संख्या को दर्शाती है | What is the mean marks per student ? प्रति छात्र माध्य अंक कितना है ?

The given Bar Graph presents the number of students of two schools for six years. दिया गया दंड आरेख छः वर्ष की अवधि में दो विद्यालयों में छात्रों की संख्या को दर्शाता है | What is the average number of students from school B during the six year period (correct to two decimal places)? छः वर्षों की अवधि में विद्यालय B के छात्रों की औसत संख्या कितनी रही है? (दशमलव के दो स्थान तक )

The given Bar Graph presents the number of students of two schools for six years. दिया गया दंड आरेख छः वर्ष की अवधि में दो विद्यालयों में छात्रों की संख्या को दर्शाता है | What is the ratio of the number of students taken for all years together from school A to that from school B? सभी वर्षों को मिलाकर विद्यालय A और विद्यालय B के छात्रों की संख्या में अनुपात ज्ञात करें |

The given Bar Graph presents the number of students of two schools for six years. दिया गया दंड आरेख छः वर्ष की अवधि में दो विद्यालयों में छात्रों की संख्या को दर्शाता है | What is the average of the number of students from school A during the six year period? छः वर्षों की अवधि में विद्यालय A के छात्रों की संख्या का औसत ज्ञात करें |

The given Bar Graph presents the number of students of two schools for six years. दिया गया दंड आरेख छः वर्ष की अवधि में दो विद्यालयों में छात्रों की संख्या को दर्शाता है | In which year, the absolute difference between the numbers of students in two schools is the highest? किस वर्ष में, दोनों विद्यालयों में छात्रों की संख्या के बीच पूर्ण अंतर सबसे अधिक है ?

The following table shows the number of students enrolled in different faculties in a college. निम्नलिखित तालिका एक कॉलेज में अलग-अलग विषयों में नामांकित छात्रों की संख्या को दर्शाती है | The percentage of students studying in faculties other than Science is: विज्ञान के अतिरिक्त अन्य विषयों की पढ़ाई करने वाले छात्रों का प्रतिशत है

The given bar graph presents the number of students from Science and Arts streams from a school in different years. दिया गया दंड आरेख अलग-अलग वर्षों में एक विद्यालय में विज्ञान एवं कला संकाय के छात्रों की संख्या को दर्शाता है | What is the ratio of the total number of Science students in 2011 and 2015 to that of Arts in 2012 and 2015? 2011 तथा 2015 में विज्ञान के छात्रों की कुल संख्या का 2012 तथा 2015 में कला के छात्रों की कुल संख्या के साथ अनुपात ज्ञात करें |

PINNACLE-DATA INTERPRETATION-EXERCISE
  1. The following bar graph shows the amount of imports (in million kg) of...

    Text Solution

    |

  2. The following pie-chart shows the monthly expenditure of a family on v...

    Text Solution

    |

  3. The Table shows the number of students from different schools playing ...

    Text Solution

    |

  4. The Table shows the number of students from different schools playing ...

    Text Solution

    |

  5. The Table shows the number of students from different schools playing ...

    Text Solution

    |

  6. The Table shows the number of students from different schools playing ...

    Text Solution

    |

  7. A book has been co-authored by X and Y. The prices of the book in Indi...

    Text Solution

    |

  8. A book has been co-authored by X and Y. The prices of the book in Indi...

    Text Solution

    |

  9. A book has been co-authored by X and Y. The prices of the book in Indi...

    Text Solution

    |

  10. The Pie chart given below presents the projected revenue and various e...

    Text Solution

    |

  11. The given table shows the number (in thousands) of cars of five differ...

    Text Solution

    |

  12. The given table shows the number (in thousands) of cars of five differ...

    Text Solution

    |

  13. The given table shows the number (in thousands) of cars of five differ...

    Text Solution

    |

  14. The given table shows the number (in thousands) of cars of five differ...

    Text Solution

    |

  15. The given table represents the number of engineers recruited by four c...

    Text Solution

    |

  16. The given table represents the number of engineers recruited by four c...

    Text Solution

    |

  17. The given table represents the number of engineers recruited by four c...

    Text Solution

    |

  18. The given table represents the number of engineers recruited by four c...

    Text Solution

    |

  19. The number of students enrolled in different faculties in a school is ...

    Text Solution

    |

  20. As per the data in the table, what is the percentage of students who g...

    Text Solution

    |