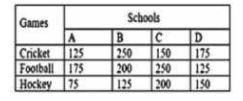
 If the data about the number of students who play hockey from different schools is represented by a pie-chart, what is the central angle of the sector representing students who play hockey from school C to the nearest whole number?
 A
B
C
D
Text Solution
Verified by Experts


PINNACLE-DATA INTERPRETATION-EXERCISE
- The Table shows the number of students from different schools playing ...
Text Solution
|
- The Table shows the number of students from different schools playing ...
Text Solution
|
- The Table shows the number of students from different schools playing ...
Text Solution
|
- A book has been co-authored by X and Y. The prices of the book in Indi...
Text Solution
|
- A book has been co-authored by X and Y. The prices of the book in Indi...
Text Solution
|
- A book has been co-authored by X and Y. The prices of the book in Indi...
Text Solution
|
- The Pie chart given below presents the projected revenue and various e...
Text Solution
|
- The given table shows the number (in thousands) of cars of five differ...
Text Solution
|
- The given table shows the number (in thousands) of cars of five differ...
Text Solution
|
- The given table shows the number (in thousands) of cars of five differ...
Text Solution
|
- The given table shows the number (in thousands) of cars of five differ...
Text Solution
|
- The given table represents the number of engineers recruited by four c...
Text Solution
|
- The given table represents the number of engineers recruited by four c...
Text Solution
|
- The given table represents the number of engineers recruited by four c...
Text Solution
|
- The given table represents the number of engineers recruited by four c...
Text Solution
|
- The number of students enrolled in different faculties in a school is ...
Text Solution
|
- As per the data in the table, what is the percentage of students who g...
Text Solution
|
- From the following table, how many patients were in the age group 40-6...
Text Solution
|
- The table below shows income (in rupees) for a particular month, toget...
Text Solution
|
- The given table represents the number of computers sold by four dealer...
Text Solution
|