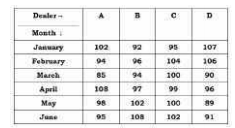
 What is the ratio of the total number of computers sold by dealer A in February, April and May to the total number of computers sold by dealer D in March, May and June? /
 A
B
C
D
Text Solution
Verified by Experts


PINNACLE-DATA INTERPRETATION-EXERCISE
- The table below shows income (in rupees) for a particular month, toget...
Text Solution
|
- The given table represents the number of computers sold by four dealer...
Text Solution
|
- The given table represents the number of computers sold by four dealer...
Text Solution
|
- The given table represents the number of computers sold by four dealer...
Text Solution
|
- The given table represents the number of computers sold by four dealer...
Text Solution
|
- The given table represents the revenue (in ₹ crores) of a company from...
Text Solution
|
- The given table represents the revenue (in ₹ crores) of a company from...
Text Solution
|
- The given table represents the revenue (in ₹ crores) of a company from...
Text Solution
|
- The given table represents the revenue (in ₹ crores) of a company from...
Text Solution
|
- The given table represents the production of different types of motorc...
Text Solution
|
- The given table represents the production of different types of motorc...
Text Solution
|
- The given table represents the production of different types of motorc...
Text Solution
|
- The given table represents the production of different types of motorc...
Text Solution
|
- The given table represents the exports (in ₹ crores) of four items A,B...
Text Solution
|
- The given table represents the exports (in ₹ crores) of four items A,B...
Text Solution
|
- The given table represents the exports (in ₹ crores) of four items A,B...
Text Solution
|
- The given table represents the exports (in ₹ crores) of four items A,B...
Text Solution
|
- The given table represents the sale (in thousands) of cars by four com...
Text Solution
|
- The given table represents the sale (in thousands) of cars by four com...
Text Solution
|
- The given table represents the sale (in thousands) of cars by four com...
Text Solution
|