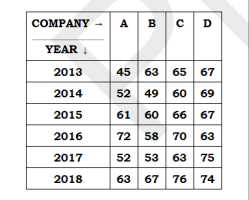
 The total number of cars sold by company B during 2015, 2017 and 2018 is what percentage less than the total number of cars sold by company C in 2013, 2015, 2017 and 2018?
 A
B
C
D
Text Solution
Verified by Experts
The correct Answer is:


PINNACLE-DATA INTERPRETATION-EXERCISE
- The given table represents the exports (in ₹ crores) of four items A,B...
Text Solution
|
- The given table represents the sale (in thousands) of cars by four com...
Text Solution
|
- The given table represents the sale (in thousands) of cars by four com...
Text Solution
|
- The given table represents the sale (in thousands) of cars by four com...
Text Solution
|
- The given table represents the sale (in thousands) of cars by four com...
Text Solution
|
- The following table shows the number of students enrolled in different...
Text Solution
|
- The following table shows the income (in rupees) for a particular mont...
Text Solution
|
- The heights of some girls in a school were noted and the data obtained...
Text Solution
|
- How many families have a monthly salary less than ₹40,000? कितने पर...
Text Solution
|
- In the following table, the production of various crops (in tonnes) is...
Text Solution
|
- In the following table, the production of various crops (in tonnes) is...
Text Solution
|
- In the following table, the production of various crops (in tonnes) is...
Text Solution
|
- In the following table, the production of various crops (in tonnes) is...
Text Solution
|
- The following table shows the income (in ₹) for a particular month, to...
Text Solution
|
- The following table shows the daily earnings of 45 skilled workers: Ho...
Text Solution
|
- The number of students enrolled in different streams in a college is s...
Text Solution
|
- During a medical check-up, the heights of 40 students in a class were ...
Text Solution
|
- The following table gives the details of five commodities A, B, C, D a...
Text Solution
|
- The following table gives the details of five commodities A,B,C,D and ...
Text Solution
|
- The following table gives the details of five commodities A,B,C,D and ...
Text Solution
|