A
B
C
D
Text Solution
Verified by Experts


PINNACLE-DATA INTERPRETATION-EXERCISE
- The number of students enrolled in different streams in a college is s...
Text Solution
|
- During a medical check-up, the heights of 40 students in a class were ...
Text Solution
|
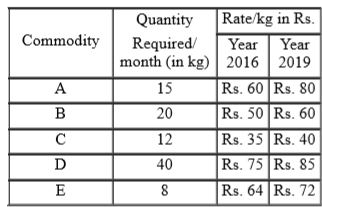
- The following table gives the details of five commodities A, B, C, D a...
Text Solution
|
- The following table gives the details of five commodities A,B,C,D and ...
Text Solution
|
- The following table gives the details of five commodities A,B,C,D and ...
Text Solution
|
- The following table gives the details of five commodities A,B,C,D and ...
Text Solution
|
- In a school, the distribution of teachers is as follows: एक विद्यालय...
Text Solution
|
- Directions: Study the given table carefully and answer the question th...
Text Solution
|
- In a particular year, the number of students enrolled in different str...
Text Solution
|
- From the given table, what is the percentage of students scoring 40 or...
Text Solution
|
- The following table shows the age-wise brand ownership of mobile phone...
Text Solution
|
- The following table shows the number of employees working in various d...
Text Solution
|
- The following table shows the annual profit of a company (in Rs. lakh)...
Text Solution
|
- Table shows the percentage of marks obtained by seven students in six ...
Text Solution
|
- The following table shows the percentage distribution of the populatio...
Text Solution
|
- The following table shows the percentage distribution of the populatio...
Text Solution
|
- The following table shows the items of expenditure of a company (in ₹ ...
Text Solution
|
- The following table showing the percentage of the total population of ...
Text Solution
|
- The following table represents the number of candidates that appeared ...
Text Solution
|
- The following table represents the number of candidates that appeared ...
Text Solution
|