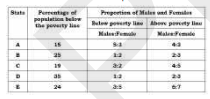
 If the male population above the poverty line for State B is 2.5 million, then what is the total population of State B?
 A
B
C
D
Text Solution
Verified by Experts


PINNACLE-DATA INTERPRETATION-EXERCISE
- The following table shows the annual profit of a company (in Rs. lakh)...
Text Solution
|
- Table shows the percentage of marks obtained by seven students in six ...
Text Solution
|
- The following table shows the percentage distribution of the populatio...
Text Solution
|
- The following table shows the percentage distribution of the populatio...
Text Solution
|
- The following table shows the items of expenditure of a company (in ₹ ...
Text Solution
|
- The following table showing the percentage of the total population of ...
Text Solution
|
- The following table represents the number of candidates that appeared ...
Text Solution
|
- The following table represents the number of candidates that appeared ...
Text Solution
|
- The following table represents the number of candidates that appeared ...
Text Solution
|
- Study the following table and answer the question. Expenditures of a C...
Text Solution
|
- In which month does company II have a contribution of approximately 20...
Text Solution
|
- The following table shows the imports and exports (in Rs. Crore) of a ...
Text Solution
|
- Direction: The following table shows the production of fertilizers (in...
Text Solution
|
- The following table shows the number of students enrolled in different...
Text Solution
|
- The following table gives the frequency of vowels used in the page of ...
Text Solution
|
- The following table shows the income (in rupees) for a particular mont...
Text Solution
|
- As per the data shown in the following table, what is the percentage o...
Text Solution
|
- The given graph shows the pass percentage of students taught by six te...
Text Solution
|
- The following graph given the annual percent profit earned by a compan...
Text Solution
|
- The following graph represents the annual percentage profit earned by ...
Text Solution
|