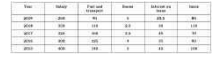
 What is the average amount of interest per year which the company had to pay during this
period?
What is the average amount of interest per year which the company had to pay during this
period? A
B
C
D
Text Solution
Verified by Experts


PINNACLE-DATA INTERPRETATION-EXERCISE
- The following table shows the percentage distribution of the populatio...
Text Solution
|
- The following table shows the percentage distribution of the populatio...
Text Solution
|
- The following table shows the items of expenditure of a company (in ₹ ...
Text Solution
|
- The following table showing the percentage of the total population of ...
Text Solution
|
- The following table represents the number of candidates that appeared ...
Text Solution
|
- The following table represents the number of candidates that appeared ...
Text Solution
|
- The following table represents the number of candidates that appeared ...
Text Solution
|
- Study the following table and answer the question. Expenditures of a C...
Text Solution
|
- In which month does company II have a contribution of approximately 20...
Text Solution
|
- The following table shows the imports and exports (in Rs. Crore) of a ...
Text Solution
|
- Direction: The following table shows the production of fertilizers (in...
Text Solution
|
- The following table shows the number of students enrolled in different...
Text Solution
|
- The following table gives the frequency of vowels used in the page of ...
Text Solution
|
- The following table shows the income (in rupees) for a particular mont...
Text Solution
|
- As per the data shown in the following table, what is the percentage o...
Text Solution
|
- The given graph shows the pass percentage of students taught by six te...
Text Solution
|
- The following graph given the annual percent profit earned by a compan...
Text Solution
|
- The following graph represents the annual percentage profit earned by ...
Text Solution
|
- The following graph shows the performance in aggregate marks of 2 boar...
Text Solution
|
- The given graph represents the percentage distribution of the total ex...
Text Solution
|