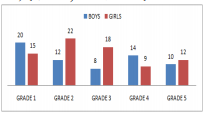
 And the bar graph below shows the percentage share of five schools in the total students studying in that class.
 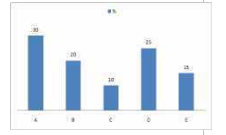 Based on the information, if the boys to girls ratio in school D is 3:1, then the number of boys studying in school D is:
 A
B
C
D
Text Solution
Verified by Experts


PINNACLE-DATA INTERPRETATION-EXERCISE
- the following graph shows the expenditure on education sector by India...
Text Solution
|
- The following graph gives the details of the male and female populatio...
Text Solution
|
- first graph shows the number of students (boys and girls in thousands)...
Text Solution
|
- A home decor company produces five different products - bed sheets, cl...
Text Solution
|
- The given bar graph represents the income and expenditure of a person ...
Text Solution
|
- The given bar graph represents the income and expenditure of a person ...
Text Solution
|
- The given bar graph represents the number of students admitted in four...
Text Solution
|
- The given bar graph represents the number of students admitted in four...
Text Solution
|
- The given bar graph represents the number of students admitted in four...
Text Solution
|
- The following graph shows the data of the collection of interest on lo...
Text Solution
|
- The given pie chart shows the percentage of students enrolled for the ...
Text Solution
|
- The following bar graph shows the marks (out of 100) of students A, B,...
Text Solution
|
- The following bar graph shows the data of the production of an item (i...
Text Solution
|
- The following graph shows the sales of cars (in thousands) in four cit...
Text Solution
|
- The following graph shows the sales of cars (in thousands) in four cit...
Text Solution
|
- The following graph shows the sales of cars (in thousands) in four cit...
Text Solution
|
- The following graph shows the sales of cars (in thousands) in four cit...
Text Solution
|
- The given graph represents the rainfall (in cm) in a city, over a peri...
Text Solution
|
- The given bar graph represents the pass percentage of the 10th and 12t...
Text Solution
|
- The given bar graph represents the pass percentage of the 10th and 12t...
Text Solution
|