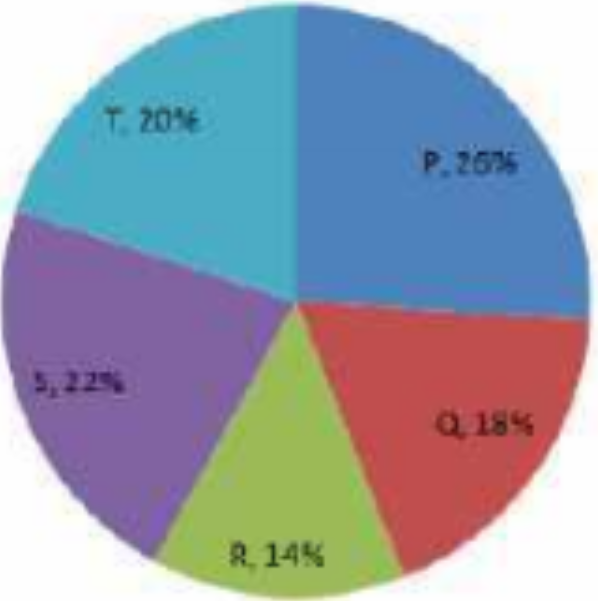
 The number of students in school T is what percentage of the total number of students in school Q and S together.
 A
B
C
D
Text Solution
Verified by Experts


PINNACLE-DATA INTERPRETATION-EXERCISE
- In the given bar graph, the Blue bar shows the income and the Red bar ...
Text Solution
|
- Study the graph and answer the following questions. आरेख का अध्ययन क...
Text Solution
|
- The following pie chart shows the percentage wise distribution of the ...
Text Solution
|
- The following graph shows the number of books sold by a book-seller du...
Text Solution
|
- The following chart shows the marks (in degrees) scored by a student i...
Text Solution
|
- The following chart shows the marks (in degrees) scored by a student i...
Text Solution
|
- Study the graph and answer the questions based on the graph: आरेख का...
Text Solution
|
- Study the following graph and answer the questions based on the graph....
Text Solution
|
- Study the graph and answer the questions based on the graph: आरेख का...
Text Solution
|
- The following bar graph shows the number of students (in hundreds) who...
Text Solution
|
- The following graph shows the number of students (in hundreds) in thre...
Text Solution
|
- Study the graph and answer (the question that follows. आरेख का अध्यय...
Text Solution
|
- Study the given chart carefully and answer the question accordingly: ...
Text Solution
|
- Study the pie-chart and the table carefully and answer the questions t...
Text Solution
|
- Study the given chart and answer the following questions: दिए गए चार...
Text Solution
|
- Study the chart and answer the questions: In which of the given year...
Text Solution
|
- Given bar graph shows, total expenditure and the gross receipts of a c...
Text Solution
|
- Given bar graph shows, total expenditure and the gross receipts of a c...
Text Solution
|
- Given bar graph shows, total expenditure and the gross receipts of a c...
Text Solution
|
- Given bar graph shows, total expenditure and the gross receipts of a c...
Text Solution
|