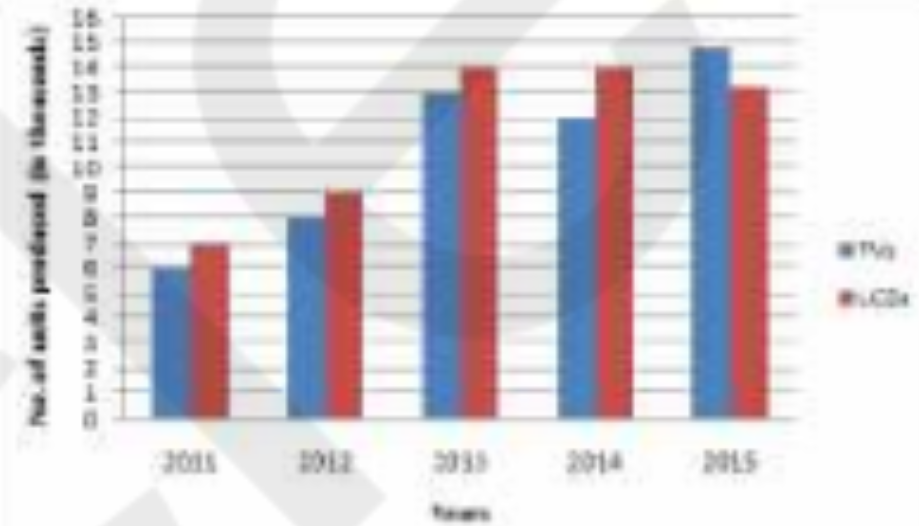
 The difference between the average production of LCDs and that of the TVs from 2011 to 2013 is
A
B
C
D
Text Solution
Verified by Experts
The correct Answer is:


PINNACLE-DATA INTERPRETATION-EXERCISE
- The pie chart shows the annual car production (percentage wise) of six...
Text Solution
|
- The bar graph shows the number of students (in hundreds) admitted and ...
Text Solution
|
- Study the following bar diagram and answer the question that follows. ...
Text Solution
|
- Study the following bar diagram and answer the question that follows. ...
Text Solution
|
- The following pie chart shows the monthly expenditure incurred by a fa...
Text Solution
|
- The following pie chart shows the monthly expenditure incurred by a fa...
Text Solution
|
- The given bar graph represents the number of students who appeared in ...
Text Solution
|
- The following pie chart shows the percentage-wise distribution of the ...
Text Solution
|
- The given bar graph represents the number of students who appeared in ...
Text Solution
|
- The given bar graph represents the number of students who appeared in ...
Text Solution
|
- Study the pie-chart and answer the questions. In an institute, there a...
Text Solution
|
- Study the following graph and answer the questions given below: What i...
Text Solution
|
- The given bar graph represents the percentage of non-electrified villa...
Text Solution
|
- The following bar graph shows the number of deaths from road accident ...
Text Solution
|
- The following bar graph shows the number of deaths from road accident ...
Text Solution
|
- The given data shows the number of mobiles (in thousands) manufactured...
Text Solution
|
- The given data shows the number of mobiles (in thousands) manufactured...
Text Solution
|
- The given data shows the number of mobiles (in thousands) manufactured...
Text Solution
|
- The given data shows the number of mobiles (in thousands) manufactured...
Text Solution
|
- The given chart shows the number of students in Class 4, Class 5, Clas...
Text Solution
|