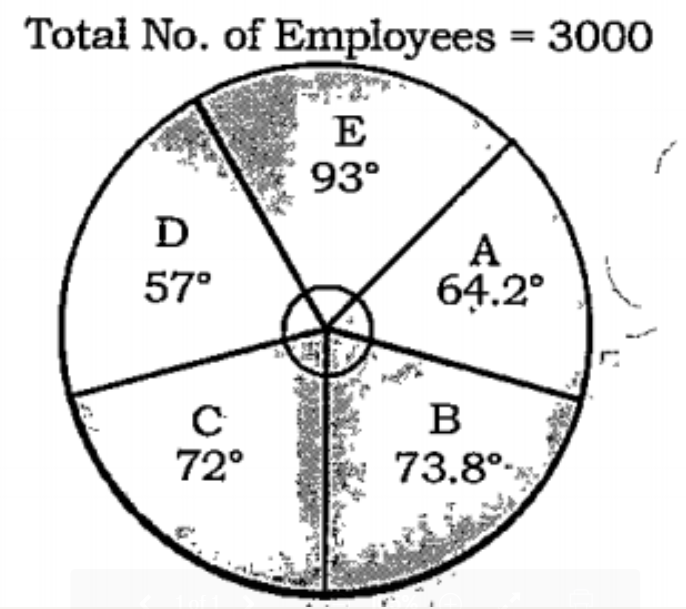
 Break up for distribution (degree wise) of the employees working in five departments (A,B,C,D, and E) in a company. If 20% of the employees working in department E are transferred to department A, then the difference between eh number of employees in A and 124% of the employees working in department C is:
 A
B
C
D
Text Solution
Verified by Experts


PINNACLE-DATA INTERPRETATION-EXERCISE
- Study the given graph and answer the question that follows. The number...
Text Solution
|
- Study the given graph and answer the questions that follow. दिए गए आ...
Text Solution
|
- Study the given graph and answer the question that follows: Break up...
Text Solution
|
- Study the given graph and answer the question that follows. दिए गए आ...
Text Solution
|
- Study the given graph and answer the question that follows: Breakup f...
Text Solution
|
- Study the given graph and asnwer the question that follows. In ho...
Text Solution
|
- Study the graph and answer the question that follows आरेख का अध्ययन ...
Text Solution
|
- Study the graph and answer the question that follows आरेख का अध्ययन ...
Text Solution
|
- Study the pie-chart and answer the questions: Break up (degree wise) o...
Text Solution
|
- Study the given graph and answer the question that follows. The t...
Text Solution
|
- Study the pie-chart and answer the options:- If the ratio of male...
Text Solution
|
- Study the given graph and answer the question that follows: The numbe...
Text Solution
|
- Study the pie chart and answer the question that follows आरेख का अध्...
Text Solution
|
- Study the following bar graph and answer the questions given below. ...
Text Solution
|
- Study the following bar graph and answer the questions given below. न...
Text Solution
|
- Study the following bar graph and answer the questions given below. न...
Text Solution
|
- Study the following pie chart and table to answer the question.Total n...
Text Solution
|
- Study the following pie chart and table to answer the question. Tot...
Text Solution
|
- Study the following histogram and answer the given question निम्नलिख...
Text Solution
|
- The given bar graph shows the number of students of two schools over a...
Text Solution
|