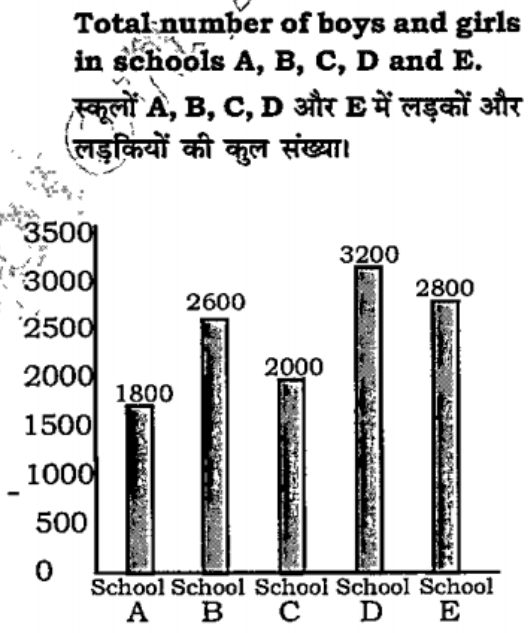
 Difference between the number
of boys and girls in school A, B, C, D and E.
Difference between the number
of boys and girls in school A, B, C, D and E.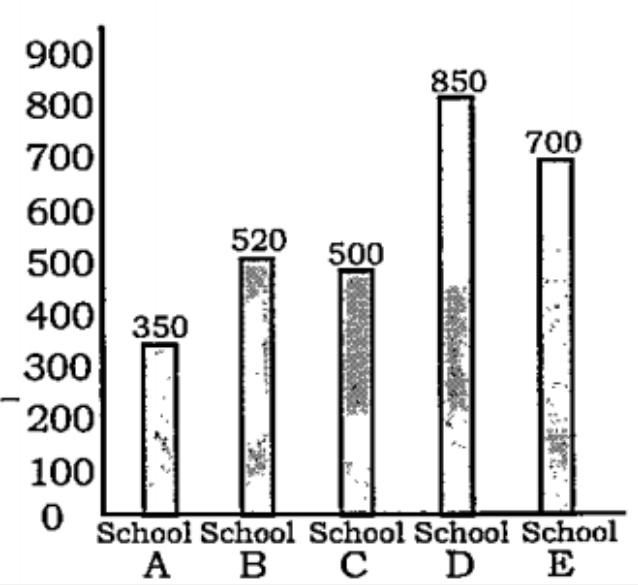 What is the ratio of number of boys to the number of girls in school E?
 A
B
C
D
Text Solution
Verified by Experts


PINNACLE-DATA INTERPRETATION-EXERCISE
- Study the pie chart and answer the question that follows आरेख का अध्...
Text Solution
|
- Study the following bar graph and answer the questions given below. ...
Text Solution
|
- Study the following bar graph and answer the questions given below. न...
Text Solution
|
- Study the following bar graph and answer the questions given below. न...
Text Solution
|
- Study the following pie chart and table to answer the question.Total n...
Text Solution
|
- Study the following pie chart and table to answer the question. Tot...
Text Solution
|
- Study the following histogram and answer the given question निम्नलिख...
Text Solution
|
- The given bar graph shows the number of students of two schools over a...
Text Solution
|
- The given bar graph shows the number of students of two shools over a ...
Text Solution
|
- The given histogram shows the height of the students. The differe...
Text Solution
|
- The given histogram shows the height of the students. What is th...
Text Solution
|
- The given pie chart represents the popularity of ice-cream flavours in...
Text Solution
|
- The given histogram shows the height of the students The number o...
Text Solution
|
- The given pie chart represents the popularity of ice-cream flavours in...
Text Solution
|
- The given pie char represents the popularity of ice-cream flavours in ...
Text Solution
|
- The given bar graph shows the number of students of two schools over a...
Text Solution
|
- The given histogram shows the frequency distribution of the speed of c...
Text Solution
|
- The given bar graph represents the number of boys and girls in five di...
Text Solution
|
- The given pie chart shows the percentage distribution of 450 employees...
Text Solution
|
- The given histogram shows the frequency distribution of the speed of c...
Text Solution
|