Home
Class 14
MATHS
Study the following bar graph and answer...

Study the following bar graph and answer the questions given below.
निम्नांकित बार ग्राफ का अध्ययन कीजिए और उसके बाद दिए गए प्रशन का उत्तर दीजिए।
Total number of boys and girls in schools A, B, C, D and E.
स्कूलों A, B, C, D और E में लड़कों और लड़कियों की कुल संख्या।


What is the difference between the number of girls in school A and the number of girls in school C?
स्कूल A में लड़कियों कीं संख्या और स्कूल C में लड़कों की संख्या में कितना अंतर है?

A

25

B

20

C

30

D

35

Text Solution

Verified by Experts

Promotional Banner

Topper's Solved these Questions

Similar Questions

Explore conceptually related problems

Study the following bar graph and answer the questions given below. निम्नांकित बार ग्राफ का अध्ययन कीजिए और उसके बाद गए प्रश्न का उत्तर दीजिए। Difference between the number of boys and girls in school A, B, C, D and E. स्कूल A, B, C, D और E में लड़कों और लड़कियों की संख्या के बीच अंतर। What is the ratio of number of boys to the number of girls in school E? स्कूल E में लड़कों की संख्या से अनुपात कितना है?

Study the following bar graph and answer the questions given below What is the difference the number of girls in school A and the number of girls in school C?

Study the following bar graph and answer the questions given below. What is the ratio of numbers of boys to the number of girls in school E?

Study the following bar graph and answer the questions given below. The number of boys in school B is what percentage of the total number of students in that school ?

Study the following bar graph and answer the questions given below. . The number of boys in school B is what percentage of the number of students in that school? निम्नांकित बार ग्राफ का अध्ययन कीजिए और उसके बाव दिए गए प्रश्न का उत्तर दीजिए। . स्कूल B में लड़कों की संख्या, उस स्कूल में विद्यार्थियों की कुल संख्या की कितने प्रतिशत है?

Study the following bar graph and answer the question given. निम्नलिखित दंड आरेख का अध्ययन करें तथा दिए गए प्रश्न का उत्तर दें | The ratio of the total demand of motorcycles of companies A, C and E to the total production of motorcycles of B and C is: कंपनी A, C और E की मोटरसाइकिल की कुल मांग और B तथा C की मोटरसाइकिल के कुल उत्पादन के बीच अनुपात ज्ञात करें

Study the following bar graph and answer the question given. निम्नलिखित दंड-आरेख (बार-ग्राफ) का अध्ययन कीजिए तथा दिए गए प्रश्न का उत्तर दीजिए: The total production of motorcycles of companies C, D and E is what per cent less than the total demand of motorcycles of all the companies during five years? कंपनी C,D और E के द्वारा मोटरसाइकिलों का कुल उत्पादन, पांच वर्षों के दौरान सभी कंपनियों की मोटरसाइकिलों की कुल मांग से कितने ग्रतिशत कम है?

Direction: Read the following table carefully and answer the questions given below: The given table shows the number of boys and girls in 5 different school: Find the average number of girls in schools B,C, and E

PINNACLE-DATA INTERPRETATION-EXERCISE
  1. Study the following bar graph and answer the questions given below. ...

    Text Solution

    |

  2. Study the following bar graph and answer the questions given below. न...

    Text Solution

    |

  3. Study the following bar graph and answer the questions given below. न...

    Text Solution

    |

  4. Study the following pie chart and table to answer the question.Total n...

    Text Solution

    |

  5. Study the following pie chart and table to answer the question. Tot...

    Text Solution

    |

  6. Study the following histogram and answer the given question निम्नलिख...

    Text Solution

    |

  7. The given bar graph shows the number of students of two schools over a...

    Text Solution

    |

  8. The given bar graph shows the number of students of two shools over a ...

    Text Solution

    |

  9. The given histogram shows the height of the students. The differe...

    Text Solution

    |

  10. The given histogram shows the height of the students. What is th...

    Text Solution

    |

  11. The given pie chart represents the popularity of ice-cream flavours in...

    Text Solution

    |

  12. The given histogram shows the height of the students The number o...

    Text Solution

    |

  13. The given pie chart represents the popularity of ice-cream flavours in...

    Text Solution

    |

  14. The given pie char represents the popularity of ice-cream flavours in ...

    Text Solution

    |

  15. The given bar graph shows the number of students of two schools over a...

    Text Solution

    |

  16. The given histogram shows the frequency distribution of the speed of c...

    Text Solution

    |

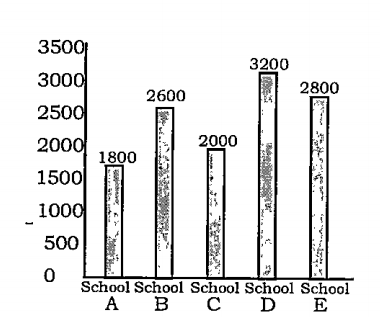
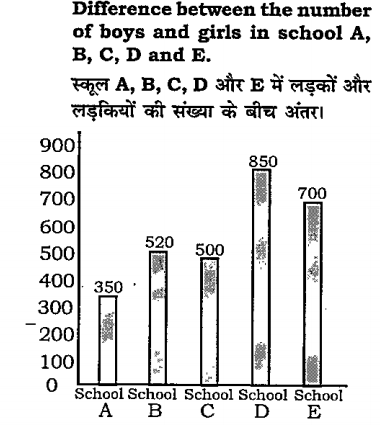
  17. The given bar graph represents the number of boys and girls in five di...

    Text Solution

    |

  18. The given pie chart shows the percentage distribution of 450 employees...

    Text Solution

    |

  19. The given histogram shows the frequency distribution of the speed of c...

    Text Solution

    |

  20. The given pie chart shows the percentage distribution of 450 employees...

    Text Solution

    |