A
B
C
D
Text Solution
Verified by Experts


PINNACLE-DATA INTERPRETATION-EXERCISE
- The given bar graph represents the number of boys and girls in five di...
Text Solution
|
- The given pie chart shows the percentage distribution of 450 employees...
Text Solution
|
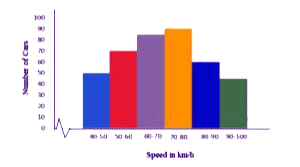
- The given histogram shows the frequency distribution of the speed of c...
Text Solution
|
- The given pie chart shows the percentage distribution of 450 employees...
Text Solution
|
- In the given bar graph what is the ratio of the total boys and girls i...
Text Solution
|
- The given pie chart shows the percentage distribution of 450 employees...
Text Solution
|
- The given bar graph represents the number of bodys and girls in five d...
Text Solution
|
- The given histogram shows the frequency distribution of the speed of c...
Text Solution
|
- The given pie chart shows the percentage distribution of 450 employees...
Text Solution
|
- The given histogram shows the frequency distribution of the speed of c...
Text Solution
|
- The given pie chart shows the percentage distribution of 450 employees...
Text Solution
|
- The given histogram shows the frequency distribution of the speed of c...
Text Solution
|
- The given histogram shows the frequency distribution of the speed of c...
Text Solution
|
- the given bar graph represents the number of boys and girls in five di...
Text Solution
|
- The given pie chart shows the percentage distribution of 450 employees...
Text Solution
|
- The given bar graph represents the number of boys and girls in five di...
Text Solution
|
- The given bar graph represents the number of bodys and girls in five d...
Text Solution
|
- The following pie chart shows percentage expenditure of a country on d...
Text Solution
|
- Study the given histogram that shows the marks obtained by students in...
Text Solution
|
- The following pie chart shows percentage expenditure of a country on d...
Text Solution
|