A
B
C
D
Text Solution
Verified by Experts


Topper's Solved these Questions
Similar Questions
Explore conceptually related problems
PINNACLE-DATA INTERPRETATION-EXERCISE
- Study the given histogram that shows the marks obtained by students in...
Text Solution
|
- The given bar graph shows the sales of cars from six branches of a dea...
Text Solution
|
- The following pie chart shows percentage expenditure of a country on d...
Text Solution
|
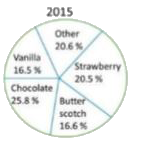
- The given pie chart represents the popularity of ice-cream flavours in...
Text Solution
|
- The following histogram shows the weight of the students of class X in...
Text Solution
|
- The given bar graph shows the number of students of two schools over a...
Text Solution
|
- The given pie chart represents the popularity of ice-cream flavours in...
Text Solution
|
- The given Bar Graph presents the number of students of two schools for...
Text Solution
|
- The given bar graph shows the number of students of two schools over a...
Text Solution
|
- The given histogram shows the height of the students: दिए गए हिस्टोग...
Text Solution
|
- The given pie chart represents the popularity of ice-cream flavours in...
Text Solution
|
- The given histogram shows the height of the students: दिए गए हिस्टोग...
Text Solution
|
- Study the given histogram that shows the marks obtained by students in...
Text Solution
|
- The number of students in class XI in science, arts and commerce strea...
Text Solution
|
- The following pie chart shows percentage expenditure of a country on d...
Text Solution
|
- Study the given histogram that shows the marks obtained by students in...
Text Solution
|
- Study the given histogram that shows the marks obtained by students in...
Text Solution
|
- The following pie chart shows percentage expenditure of a country on d...
Text Solution
|
- The following pie chart shows percentage expenditure of a country on d...
Text Solution
|
- The number of students in class XI in science, arts and commerce strea...
Text Solution
|