Home
Class 14
MATHS
In the data given below, the number of s...

In the data given below, the number of sixes and the batsmen who hit them, has been shown.
नीचे दिए गए आंकड़ों में छक्कों की संख्या तथा उन्हें जड़ने वाले बल्लेबाजों की संख्या को दिखाया गया है |

What is the median of the number of sixes ?
छक्कों की संख्या की मध्यिका (Median) कितनी है ?

A

3

B

5

C

4

D

4.5

Text Solution

Verified by Experts

Promotional Banner

Topper's Solved these Questions

Similar Questions

Explore conceptually related problems

The data below shows the number of wickets taken by each bowler and the number of bowlers who took them. नीचे दिए गए आंकड़ों में प्रत्येक गेंदबाज़ के द्वारा लिए गए विकटों की संख्या तथा इन विकटों को लेने वाले गेंदबाजों की संख्या दी गयी है | What is the median of the number of wickets? विकटों की संख्या की मध्यिका कितनी है ?

The data below shows the number of batsman having different batting averages. नीचे दिए गए आंकड़ों में विभिन्न बल्लेबाजी औसत वाले बल्लेबाजों की संख्या को दर्शाया गया है | What is the mean batting average per batsman ? प्रति बल्लेबाज माध्य बललेबाज़ी औसत कितना है ?

The data given below presents number of households corresponding to the number of children residing therein. नीचे दिए गए आंकड़ें घरों की संख्या तथा उनमें रहने वाले बच्चों की संख्या को दशति हैं | What is the difference (correct up to two decimal places) between the mean and the median of the number of the children? बच्चों की संख्या के माध्य एवं मध्यिका में क्या अंतर ( दशमलव के दो स्थान तक ) है ?

The bar graph given below shows the number of men and women working in the five different companies. नीचे दिया गया दंड आरेख पाँच विभिन्न कंपनियों में कार्य करने वाले पुरुषों तथा महिलाओं की संख्या को दर्शाता है | What is the average number of women working per company ? कार्य करने वाली महिलाओं की प्रति कंपनी औसत संख्या कितनी है ?

The Bar graph shown below presents the number of employees in an office during eight consecutive years. नीचे दिया गया दंड आरेख किसी कार्यालय में आठ लगातार वर्षों के दौरान कर्मचारियों की संख्या को दर्शाता है | What is the average number of employees per year? प्रति वर्ष कर्मचारियों की औसत संख्या कितनी है ?

The bar graph given below shows the number of men and women working in the five different companies. नीचे दिया गया दंड आरेख पाँच विभिन्न कंपनियों में कार्य करने वाले पुरुषों तथा महिलाओं की संख्या को दर्शाता है | What is the ratio of the total number of men working the companies C2 and C3 to the total number of women working in the companies C1 and C5 ? C2 तथा C3 कंपनियों में कार्य करने वाले पुरुषों की कुल संख्या C1 तथा C5 तथा कंपनियों में कार्य करने वाली महिलाओं की कुल संख्या का अनुपात कितना है ?

Find the number of triangles in the following figure ? दी गई आकृति में त्रिभुजों की संख्या क्या है?

The table given below shows the number of students having obtained different marks नीचे दी गयी तालिका अलग-अलग अंक प्राप्त करने वाले छात्रों की संख्या को दर्शाती है | What is the mean marks per student ? प्रति छात्र माध्य अंक कितना है ?

The Bar graph given below presents the number of shoes manufactured by a company on the different days of a week. नीचे दिया गया दंड आरेख एक कंपनी के द्वारा सप्ताह के अलग-अलग दिनों को बनाए गए जूतों की संख्या प्रस्तुत करता है | What is the total number of shoes manufactured by the company on all seven days together? सभी सात दिनों को मिलाकर कंपनी के द्वारा बनाए गए जूतों की कुल संख्या कितनी है ?

The bar graph given below shows the number of cars parked in a parking area during ten different days . नीचे दिया गया दंड आरेख किसी पार्किंग क्षेत्र में दस अलग-अलग दिनों में खड़ी कारों की संख्या को दर्शाता है What is the difference between the numbers of cars parked in D3 and D8 ? D3 तथा D8 में खड़ी कारों की संख्या का अंतर कितना है ?

PINNACLE-MEAN, MEDIAN & MODE-EXERCISE
  1. What is the mode of the given data दिए गए आंकड़ों का बहुलक कितना है...

    Text Solution

    |

  2. Median of the given data is दिए गए आंकड़ों की मध्यिका है : 6,2,3,5,9...

    Text Solution

    |

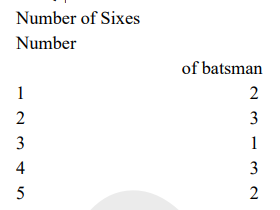
  3. In the data given below, the number of sixes and the batsmen who hit t...

    Text Solution

    |

  4. The marks obtained by various students have been shown in the data giv...

    Text Solution

    |

  5. The data below shows the number of batsman having different batting av...

    Text Solution

    |

  6. What is the median of 7,18, 6, 9, 4, 15, 21, 14, 26? 7, 18, 6, 9, 4,...

    Text Solution

    |

  7. The data below shows the number of wickets taken by each bowler and th...

    Text Solution

    |

  8. What is the mode of the given data? दिए गए आंकड़ों का बहुलक ज्ञात कर...

    Text Solution

    |

  9. What is the difference of mean and median of the given data . दिए गए...

    Text Solution

    |

  10. The data given below presents number of households corresponding to th...

    Text Solution

    |

  11. What is the median of the given data? दिए गए आंकड़ों की मध्यिका ज्ञा...

    Text Solution

    |

  12. What is the median of the numbers इन संख्याओं की मध्यिका क्या है ? 2...

    Text Solution

    |

  13. The marks of Nine students in ascending order for a test are given bel...

    Text Solution

    |

  14. The mean of 20 observations was 85 but later it was found that 97 was ...

    Text Solution

    |

  15. The median of the given data is: दिए गए डाटा की माधियका है : 1/2, 2/...

    Text Solution

    |

  16. The temperature in ^@C of 11 days recorded as follows: 29, 32, 30, 15...

    Text Solution

    |

  17. The heights of students are given in cm as 161, 190, 185, 163, 172, 18...

    Text Solution

    |

  18. A set of data is given. The mean of the set is 35 while the median is ...

    Text Solution

    |

  19. A set of data is as under आंकड़ों का एक समुच्चय इस प्रकार है: 4, 2,3...

    Text Solution

    |

  20. The marks of Eleven students in ascending order for a test are given b...

    Text Solution

    |