


Topper's Solved these Questions
Similar Questions
Explore conceptually related problems
MBD-MOTION IN A STRAIGHT LINE-EXERCISE
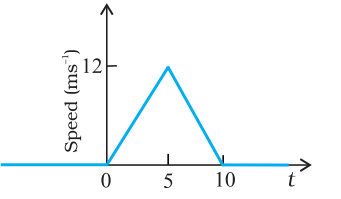
- The speed-time graph of a particle moving along a fixed direction is s...
Text Solution
|
- In which of the following examples of motion, can the body be conside...
Text Solution
|
- Give an example where displacement of a particle is equal to the dista...
Text Solution
|
- Is it true that a body is always at rest in a frame which is fixed to ...
Text Solution
|
- Does the speedometer of a car measure its average speed ?
Text Solution
|
- What does the slope of position-time graph represents?
Text Solution
|
- Which of the following is true for displacement ? (i) it cannot be zer...
Text Solution
|
- Read each statement below carefully and state with reasons and example...
Text Solution
|
- Discuss if a body moving with uniform velocity is in equilibriuim or n...
Text Solution
|
- Can the velocity of an object be in a direction other than the directi...
Text Solution
|
- Can an object be at rest as well as in motion at the same time ?
Text Solution
|
- Define motion in one, two and three dimensions giving one example of e...
Text Solution
|
- State and explain the concept of displacement. Mention its characteri...
Text Solution
|
- Show that x = x0 + vt or s = vt
Text Solution
|
- Fill in the blanks: Relative velocity .
Text Solution
|