A
B
C
D
Text Solution
Verified by Experts


Topper's Solved these Questions
Similar Questions
Explore conceptually related problems
MBD-THERMAL PROPERTIES OF MATTER-EXERCISE
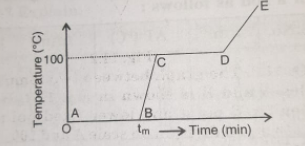
- Refer to the plot of temperature versus time (shown in the figure) sho...
Text Solution
|
- What is the value of Rydberg constant?
Text Solution
|
- What is an ideal gas ?
Text Solution
|
- Of metal and alloy, which has greater value of temperature coefficient...
Text Solution
|
- What is SI unit of coefficient fo linear expansion?
Text Solution
|
- Why is J called as conversion factor?
Text Solution
|
- Do water and ice have the same specific heats?
Text Solution
|
- Distinguish between heat and temperature.
Text Solution
|
- What is meant by the statement that heat is an energy in transit?
Text Solution
|
- Why are two ends of a long bridge generally kept on trolley?
Text Solution
|
- Define specific heat.
Text Solution
|
- A brass and an iron rod are each of one metre long at 0^@C. Find the d...
Text Solution
|
- What is meant by coefficient of linear expansion, superficial expansio...
Text Solution
|
- How is molar specific heat different from specific heat?
Text Solution
|
- Define calorimetry. What is its principle?
Text Solution
|