


Similar Questions
Explore conceptually related problems
Recommended Questions
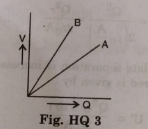
- The graphs shows the variation of voltage V across the plates of two c...
Text Solution
|
- Shows the variation of voltage V across the plates of two capacitors A...
Text Solution
|
- The graph in Fig, shows variation of total energy U stored in the capa...
Text Solution
|
- Two identical capacitors are connected in series with a source of cons...
Text Solution
|
- A capacitor of unknown capacitance is connected across a battery of V ...
Text Solution
|
- चित्र में दो संधारित्रों A व B के लिए आवेश q तथा विभवांतर V के बीच ग्र...
Text Solution
|
- Figure shows charge (q) versus voltage (V) graph for series and parall...
Text Solution
|
- The energy stored in a capacitor is given by (V = Voltage, C = Capacit...
Text Solution
|
- A capacitor of capacitance C is connected to a voltage source of p.d. ...
Text Solution
|