


Similar Questions
Explore conceptually related problems
Recommended Questions
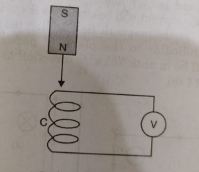
- The figures SAQ 13(a) shows a bar magnet M falling under gravity throu...
Text Solution
|
- The current is an induction coil varies with time t, according to the ...
Text Solution
|
- The graph Shows the variation in magnetic flux phi(t) with time throug...
Text Solution
|
- The graph shows the variation in magnetic flux phi (t) with time throu...
Text Solution
|
- The current i in an induction coil varies with time t according to the...
Text Solution
|
- The graph shows the variation in magnetic flux phi(t) with time throug...
Text Solution
|
- एक छोटा दण्ड-चुम्बक M एक कुण्डली में नियत चाल से गुजरता है । निम्नलिखि...
Text Solution
|
- दिए गए चित्र में एक छड़ - चुंबक M गुरुत्व के अधीन एक कुंडली C से होकर ...
Text Solution
|
- The current i in an induction coil varies with time t according to the...
Text Solution
|