


Similar Questions
Explore conceptually related problems
Recommended Questions
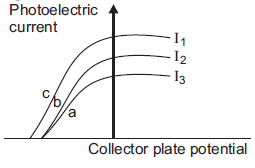
- The figure VSAQ 29 shows a plot of three curves a,b,c, showing the var...
Text Solution
|
- Draw a plot showing the variation of photoelectric current with collec...
Text Solution
|
- The graph of Fig. shows the variation of photoelectric current with co...
Text Solution
|
- The Fig shows a plot of three curves a, b, c showing the variation of ...
Text Solution
|
- Draw a plot showing the variation of photoelectric current with collec...
Text Solution
|
- The following graph shows the variation of photoelectric current for a...
Text Solution
|
- The variation of photocurrent with collector potential for different f...
Text Solution
|
- चित्र में संग्राहक विभव एवं प्रकाश वैधुत धारा के मध्य तीन वक्र ...
Text Solution
|
- Fig. shows variation of photocurrent with anode potential for photosen...
Text Solution
|