


MBD-Photosynthesis in Higher Plants-Exercise
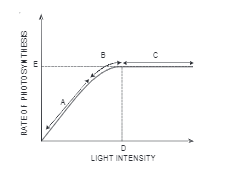
- Figure shows the effect of light on the rate of phtosynthesis. Based o...
Text Solution
|
- NaDP reductase enxyme is located on …………..
Text Solution
|
- Can girdling experiments be done in monocots? If yes, how? If no, why ...
Text Solution
|
- Does moonlight support phoosynthesis? Find out.
Text Solution
|
- Name the specialesed cells where photosynthesis occurs.
Text Solution
|
- What is assimilatory power? When it is produced?
Text Solution
|
- Why is ATP essential for photosynthesis?
Text Solution
|
- Chlorophyll 'a' is the primary pigment for light reaction?
Text Solution
|
- What conditions enable RubisCO to function as an oxygenase? Explain th...
Text Solution
|
- Differentiate absorption spectrum and action spectrum.
Text Solution
|
- Explain the role of cholorophyll a molecule as reaction centre for har...
Text Solution
|
- Differentiate Photosystem-I and Photosystem-II
Text Solution
|
- Describe Hill reaction. What is its significance?
Text Solution
|
- Write graphic representation of C4 cycle.
Text Solution
|
- Describe Calvin cycle.
Text Solution
|