Home
Class 12
PHYSICS
The figure below shows a graph of potent...

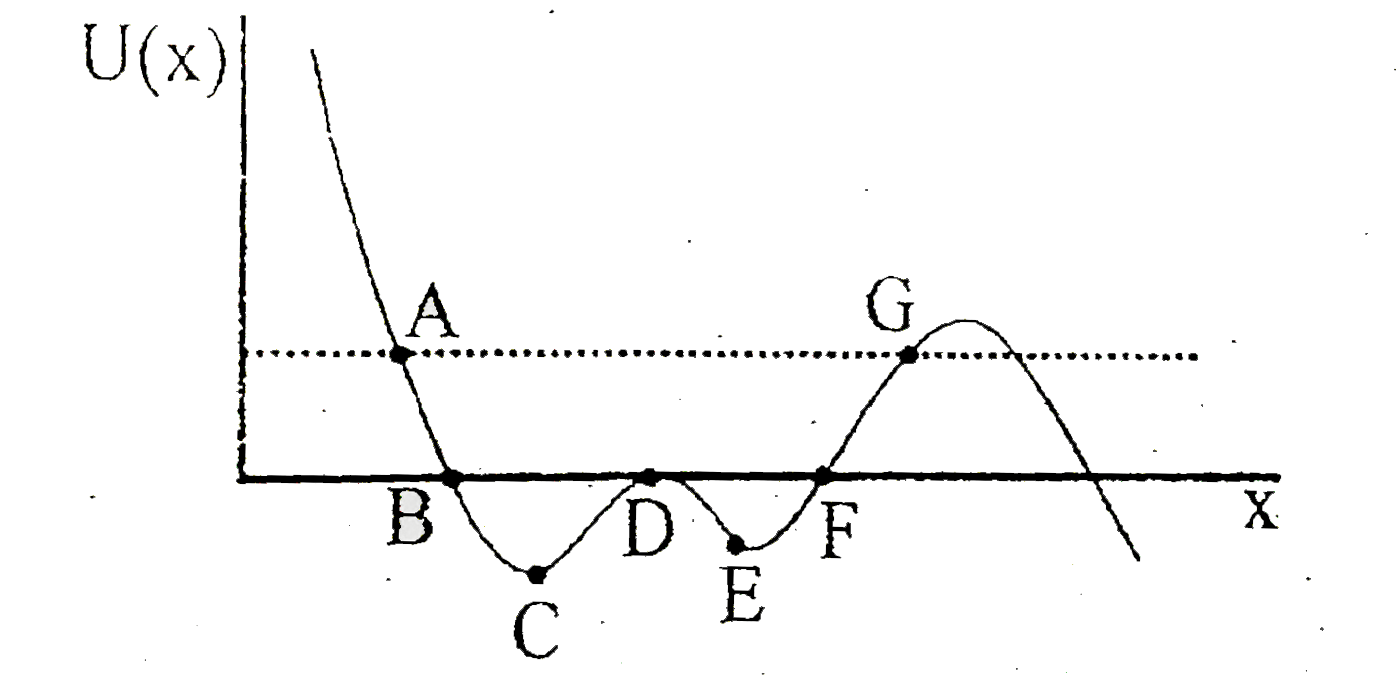
The figure below shows a graph of potential energy U(x) verses position x for a particle executing one dimensional motion along the x axis. The total mechanical energy of the system is indicated by the dashed line. At t=0 the particle is somewhere between points A and G. For later times choose the correct statement:-

A

The magnitude of force is maximum at D

B

The kinetic energy is maximum at B

C

The velocity is zero at A `&` G

D

The magnitude of force is minimum at F

Text Solution

Verified by Experts

The correct Answer is:
C

`F=(dU)/(dx)` and K+U=E
Promotional Banner

Topper's Solved these Questions

  • TEST PAPERS

    ALLEN |Exercise PAPER 2|60 Videos
  • TEST PAPERS

    ALLEN |Exercise PAPER 3|92 Videos
  • TEST PAPER 4

    ALLEN |Exercise PHYSICS|45 Videos
  • UNIT & DIMENSIONS, BASIC MATHS AND VECTOR

    ALLEN |Exercise Exercise (J-A)|7 Videos