A
B

C
D
Text Solution
Verified by Experts
The correct Answer is:


Similar Questions
Explore conceptually related problems
Recommended Questions
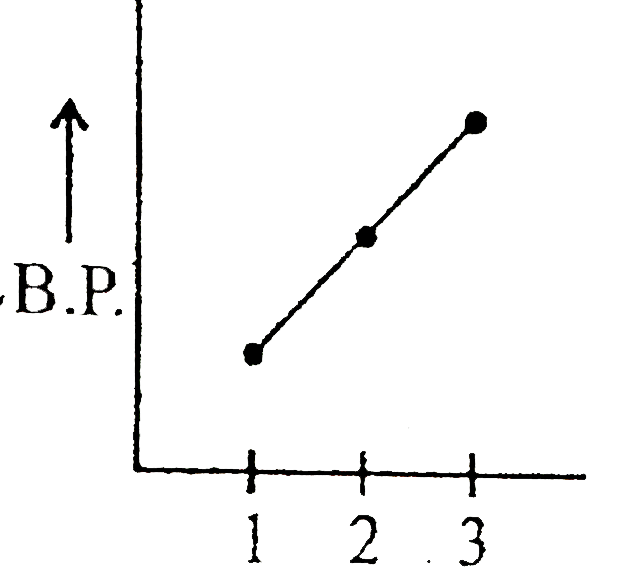
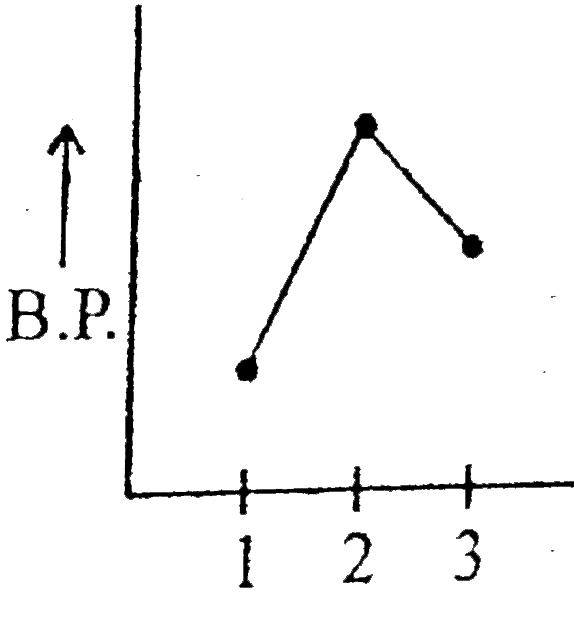
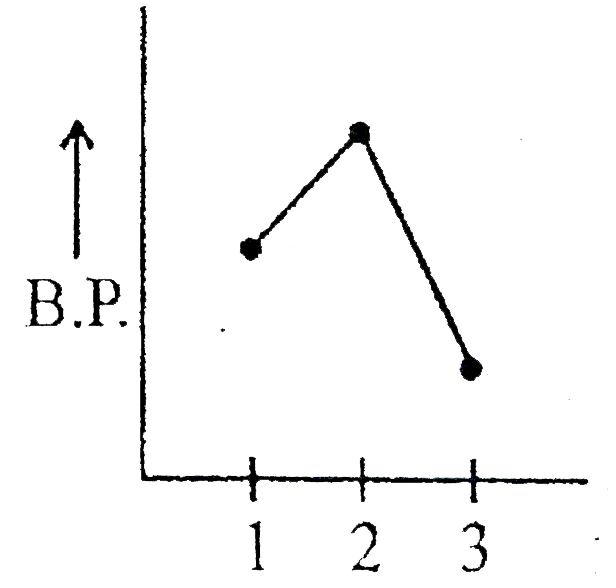
- Which graph represents correct for boiling point of:- (1) Ethane (2) ...
Text Solution
|
- Which graph represents correct for boiling point of:- (1) Ethane (2) ...
Text Solution
|
- एथिल ऐल्कोहॉल से ऐसीटिक अम्ल ।
Text Solution
|
- ऐसीटिक अम्ल से एथिल ऐल्कोहॉल ।
Text Solution
|
- Ethyl alcohol : CH3 - CH2 - OH : : Acetic Acid: .............. .
Text Solution
|
- When acetic acid reacts with ethyl alcohol In presence of conc H(2)SO(...
Text Solution
|
- ইথাইল অ্যালকোহল এবং ফরমিক আ্যসিডের আণবিক ভর একই হওয়া সত্বেও ফমিক আ্যস...
Text Solution
|
- What is the boiling point of ethyl alcohol?
Text Solution
|
- The correct order of Boiling points is
Text Solution
|