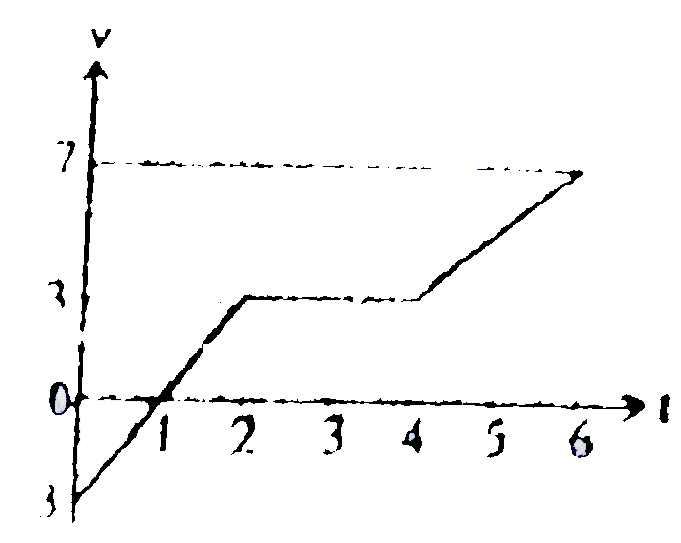
A
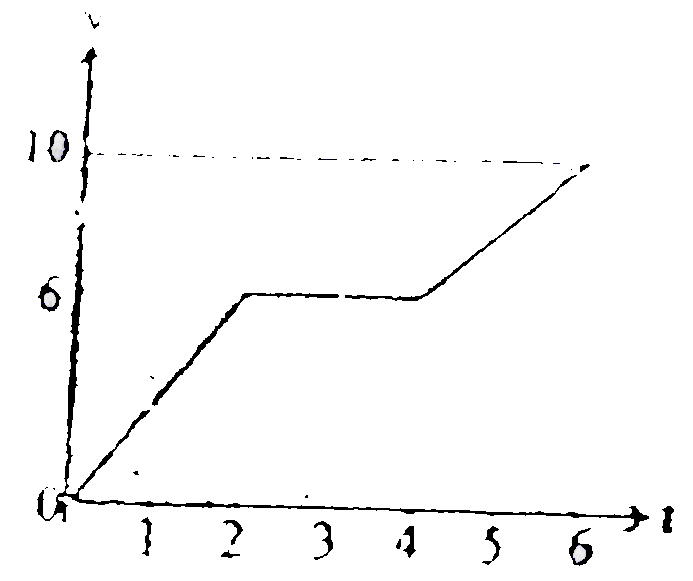
B
C
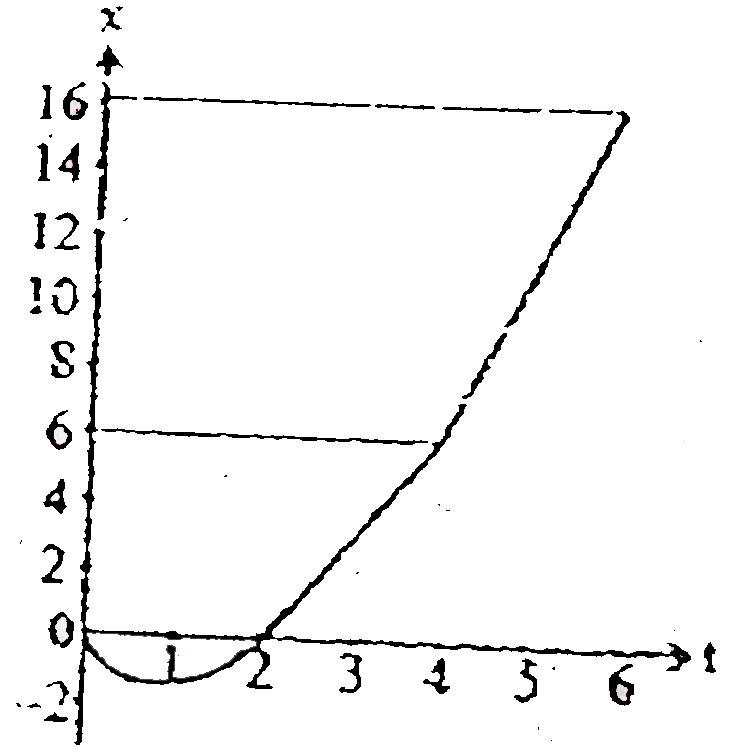
D
Text Solution
Verified by Experts
The correct Answer is:


Topper's Solved these Questions
Similar Questions
Explore conceptually related problems
ALLEN -TEST PAPER-PHYSICS
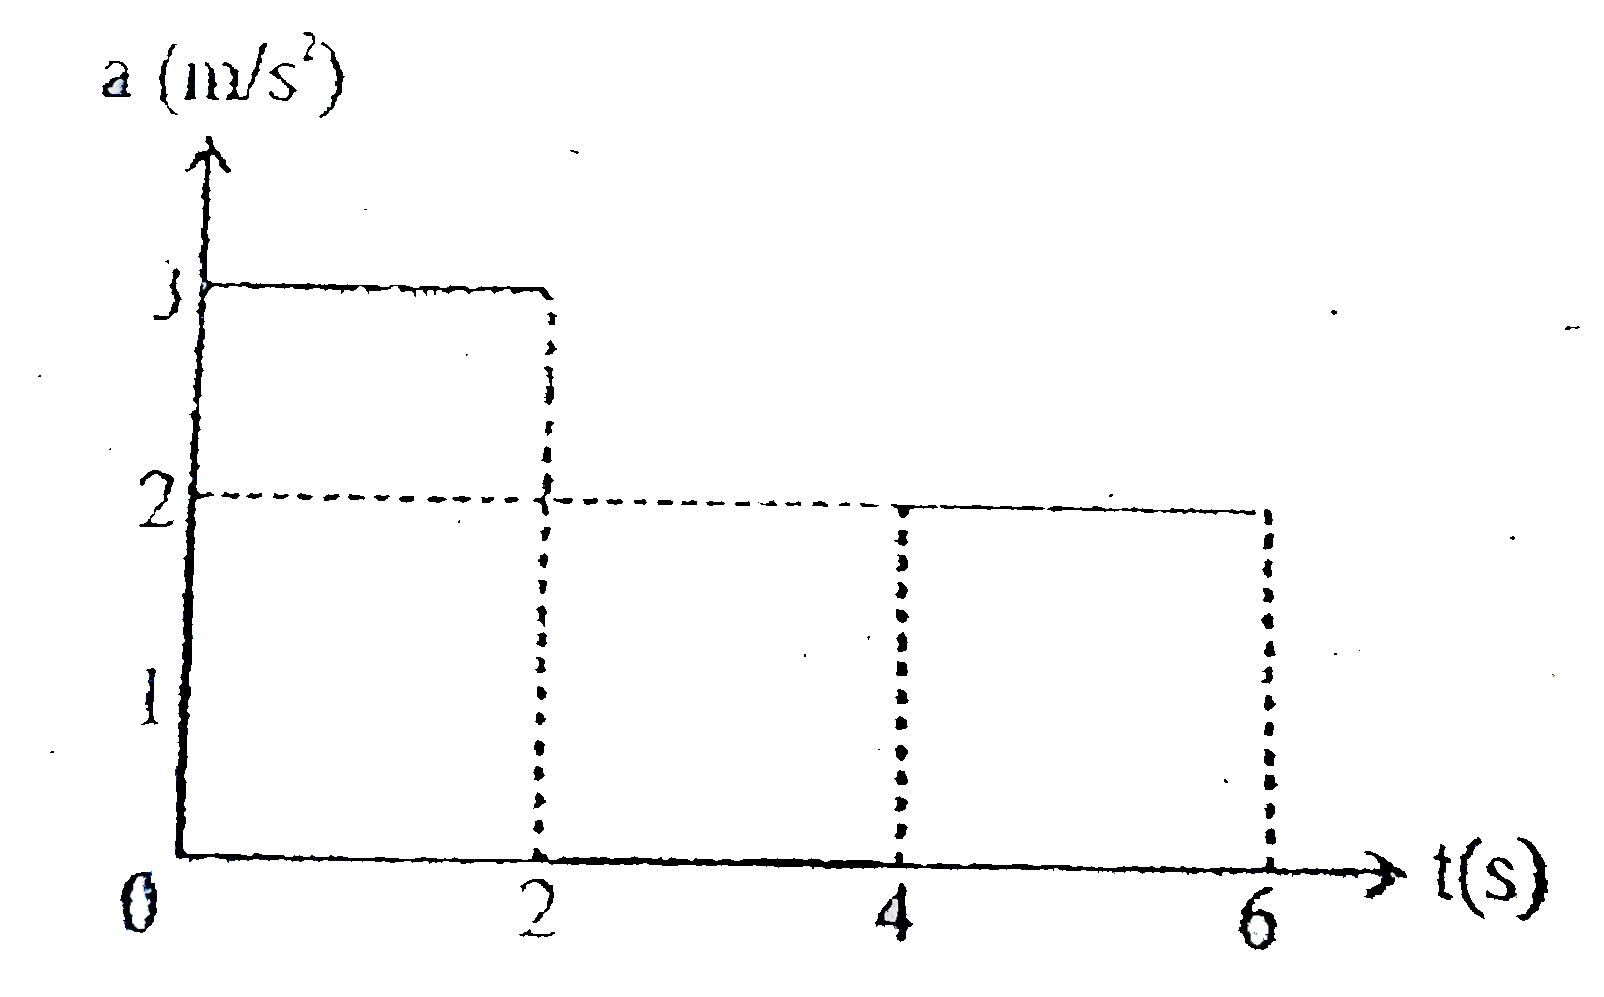
- The dependence of the acceleration of a body with time is shown in Fig...
Text Solution
|
- Choose the correct statement:
Text Solution
|
- Initially elongation in spring is 5 cm and blocks are at rest. An exte...
Text Solution
|
- Figure shows path of two projectiles A and B choose the correct option...
Text Solution
|
- A particle moves in straight line. Acceleration of particle changes wi...
Text Solution
|