A
B
C
D
Text Solution
Verified by Experts
The correct Answer is:


Topper's Solved these Questions
RACE
ALLEN |Exercise Basic Maths (Thermal Physics) (Mode of Heat Transfer)|15 VideosRACE
ALLEN |Exercise Basic Maths (Thermal Physics) (Kinetic theory of gasess)|14 VideosRACE
ALLEN |Exercise Basic Maths (Thermal Physics) (Temperature scales & thermal expansion)|14 VideosNEWTONS LAWS OF MOTION
ALLEN |Exercise EXERCISE-III|28 VideosSIMPLE HARMONIC MOTION
ALLEN |Exercise Example|1 Videos
Similar Questions
Explore conceptually related problems
ALLEN -RACE-Basic Maths (Thermal Physics) (Calorimetry)
- Two liquids A and B are at 30^@C and 20^@C, respectively When they are...
Text Solution
|
- A block of ice at -12^(@)C is slowly heated and converted into steam a...
Text Solution
|
- The water equivalent of 20 g of aluminium (specific heat 0.2" cal"//g-...
Text Solution
|
- 100 g of ice (latent heat 80 cal/g, at 0^(@)C) is mixed with 100 g of ...
Text Solution
|
- If 10 g of ice at 0^(@)C is mixed with 10 g of water at 40^(@)C. The f...
Text Solution
|
- A 10 g ice cube is dropped into 45 g of water kept in a glass. If the ...
Text Solution
|
- 2g ice at 0^(@)C is mixed with 1 g steam at 100^(@)C. Find the final t...
Text Solution
|
- Surface tension of water is 0.072 Nm^(-1). The excess pressure inside ...
Text Solution
|
- Steam is passes into 22 g of water at 20^@C. The mass of water that wi...
Text Solution
|
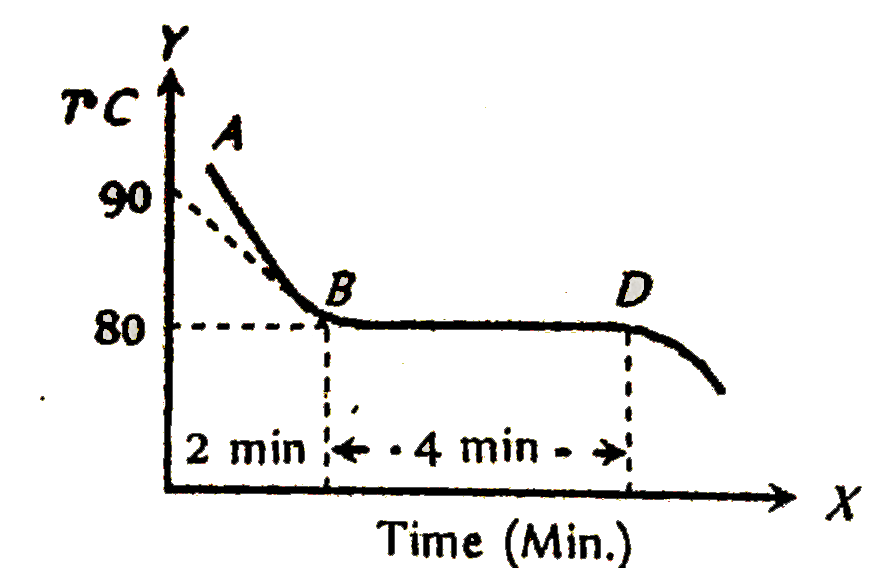
- The figure given below shows the cooling curve of pure wax material af...
Text Solution
|
- Ice at -20^(@)C mixed with 200g water at 25^(@)C. If temperature of mi...
Text Solution
|
- Calculate the time required to heat 20 kg of water from 10^(@)C to 35^...
Text Solution
|
- 1kg ice at 0^(@)C is mixed with 1kg of steam at 100^(@)C. What will be...
Text Solution
|
- Two tanks A and B contain water at 30^@C and 80^@C respectively calcul...
Text Solution
|