A
B
C
D
Text Solution
AI Generated Solution
The correct Answer is:


Similar Questions
Explore conceptually related problems
Recommended Questions
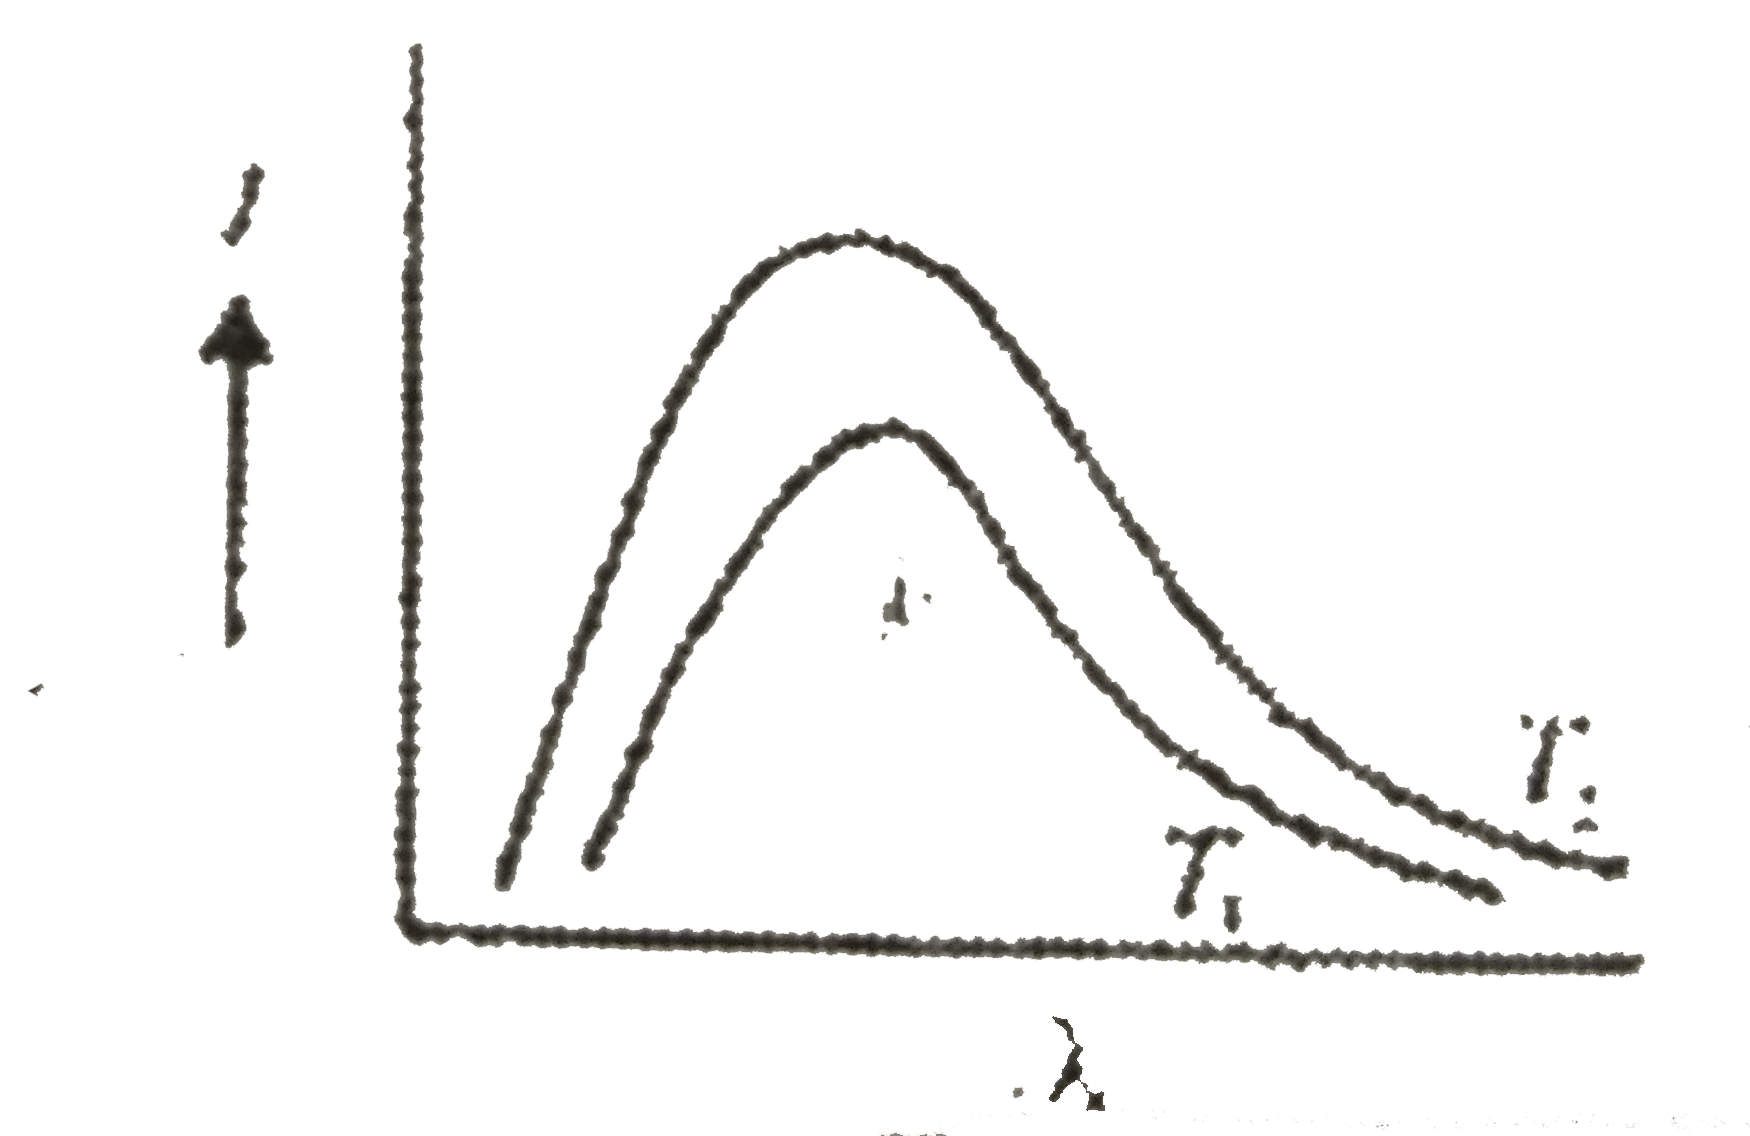
- Shown below are the black body radiation curves at temperature T(1) an...
Text Solution
|
- Shown below are the black body radiation curves at temperature T(1) an...
Text Solution
|
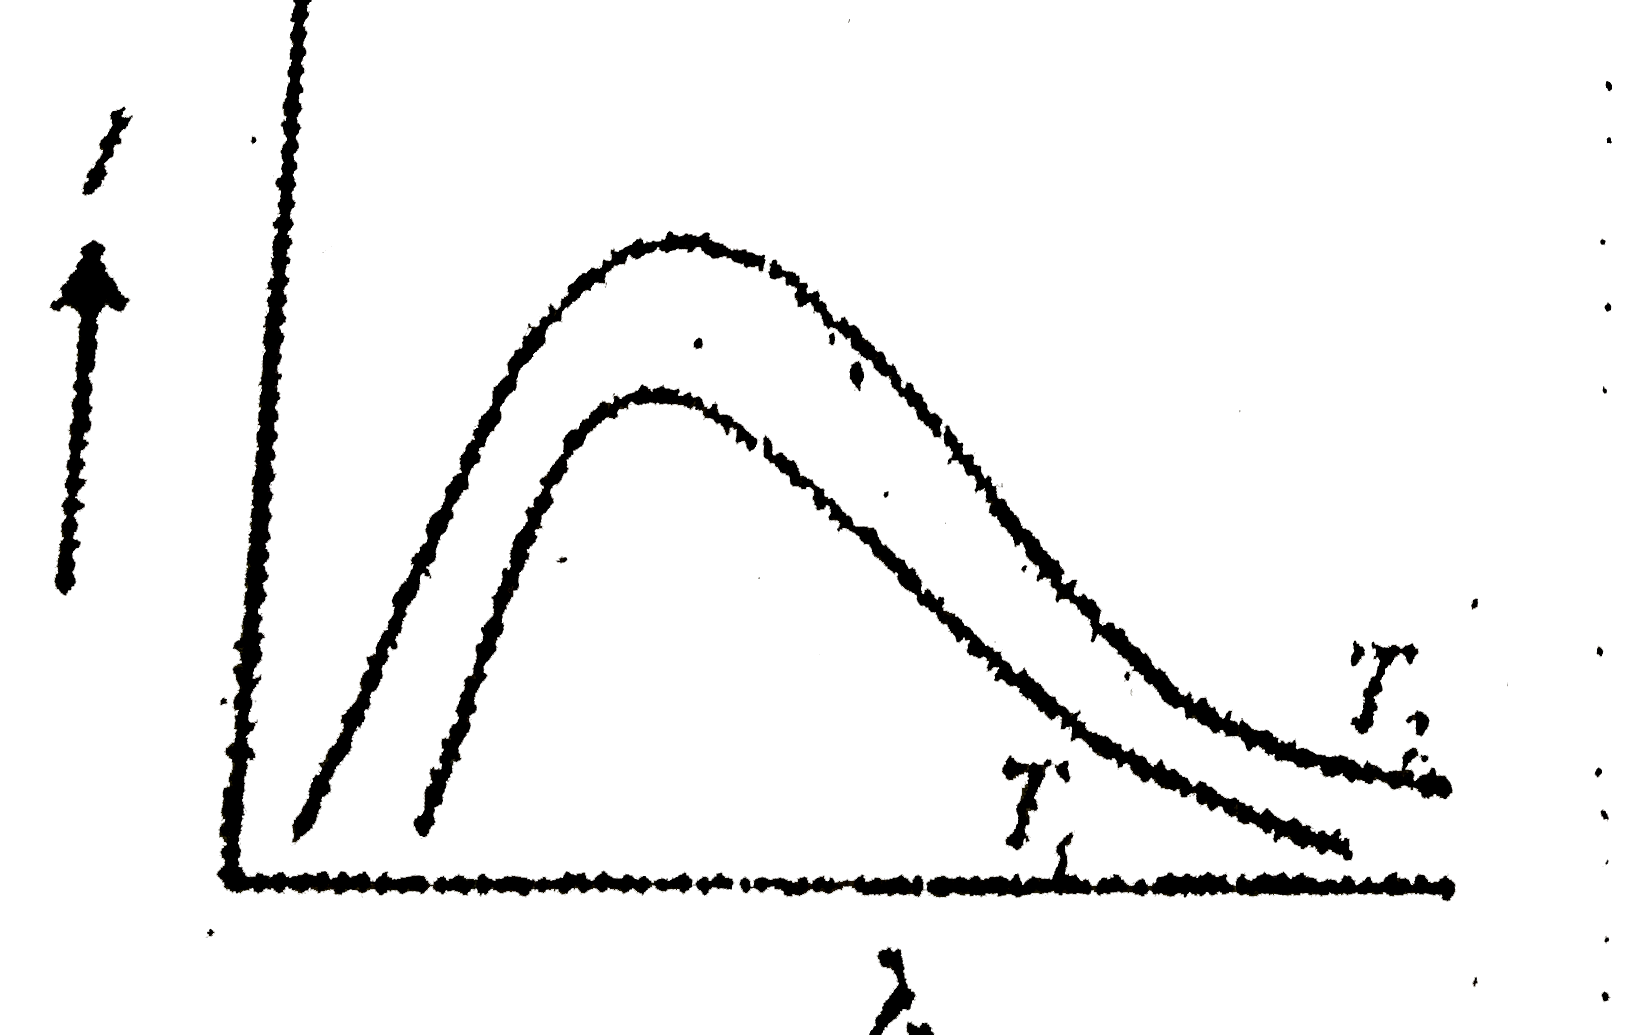
- The plots of intensity (I) of radiation versus wavelength (gamma) of t...
Text Solution
|
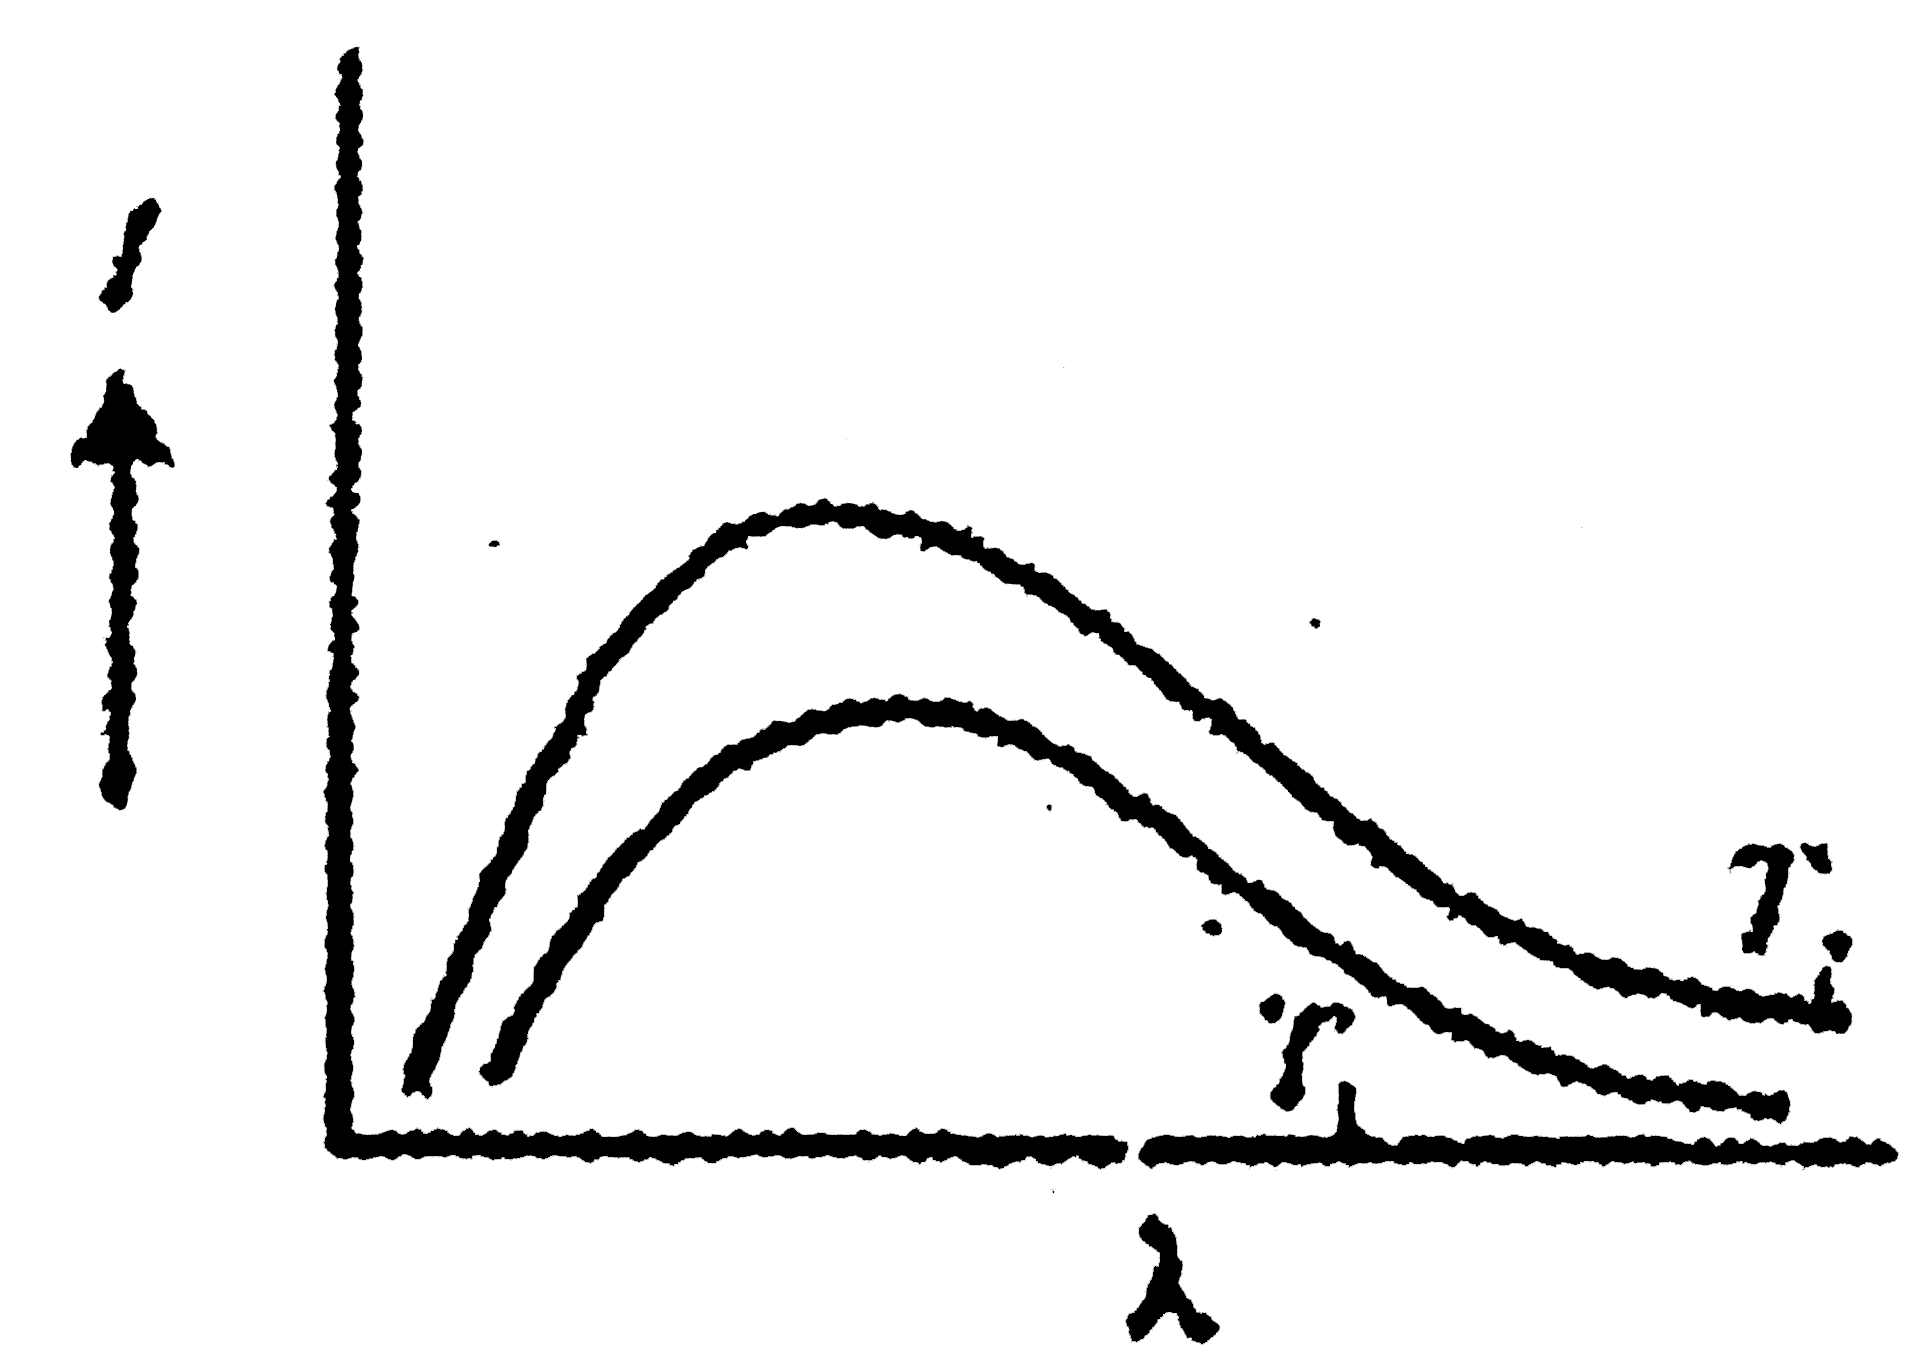
- The plots of intensity versus wavelength for three black bodies at tem...
Text Solution
|
- The plots of intensity of radiation versus wavelength of 3 black bodie...
Text Solution
|
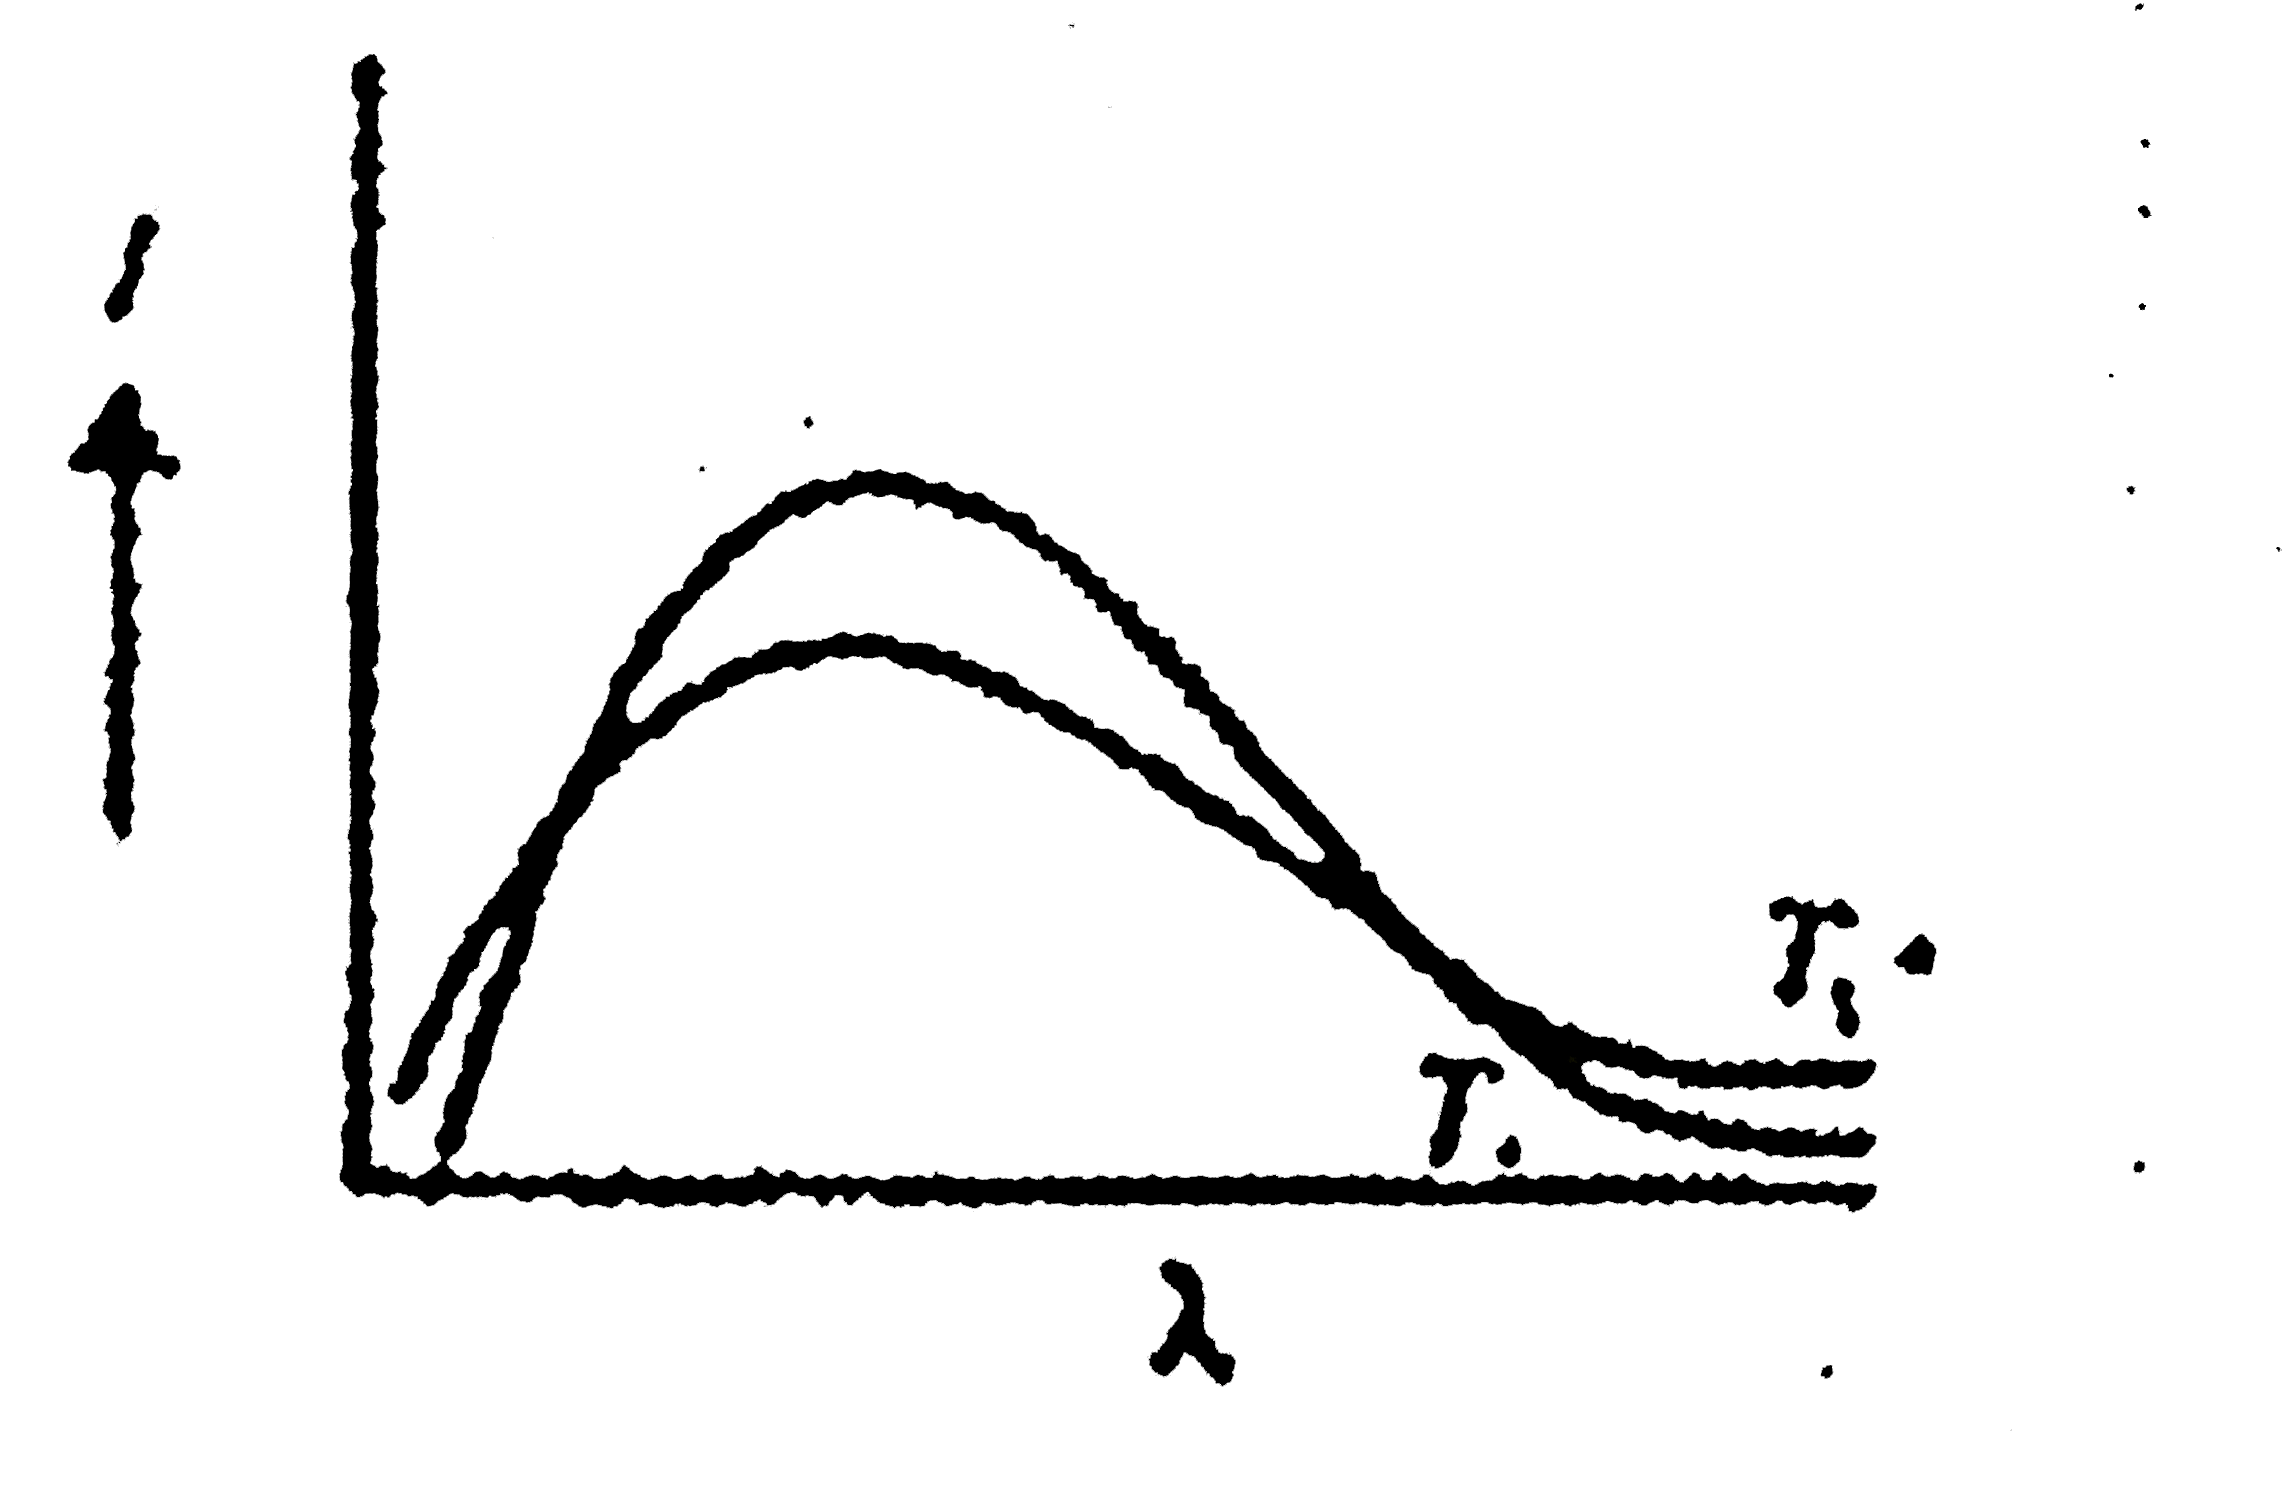
- A black body radiates heat at temperatures T(1) and T(2) (T(2) gt T(1)...
Text Solution
|
- A black body radiates heat at temperatures T(1) and T(2) (T(2) gt T(1)...
Text Solution
|
- Power radiated by a black body at temperature T(1) is P and it radiate...
Text Solution
|
- Isothermal curves for a given mass of gas are shown at two different t...
Text Solution
|