To solve the problem, we need to analyze the motion of a ball thrown vertically upwards while considering air resistance. Here’s a step-by-step breakdown of the solution:
### Step 1: Understand the Motion of the Ball
When a ball is thrown vertically upwards, it experiences two main forces: the initial upward force (due to the throw) and the downward gravitational force. Additionally, air resistance opposes the motion of the ball.
### Step 2: Analyze the Upward Motion
During the upward motion:
- The ball's speed decreases due to the gravitational pull and air resistance.
- The equation of motion can be represented as:
\[
V = U - gt
\]
where \( V \) is the final velocity, \( U \) is the initial velocity, \( g \) is the acceleration due to gravity, and \( t \) is time.
### Step 3: Analyze the Downward Motion
When the ball reaches its highest point, it starts descending:
- The speed increases, but air resistance will reduce the acceleration.
- The equation for downward motion can be represented as:
\[
V = U + gt
\]
However, since air resistance is present, the acceleration will be less than \( g \).
### Step 4: Consider the Effect of Air Resistance
With air resistance:
- The speed will not decrease to zero at the same rate during the upward motion.
- The speed will not increase during the downward motion as quickly as it would without air resistance.
- The speed-time graph will not be linear; instead, it will curve.
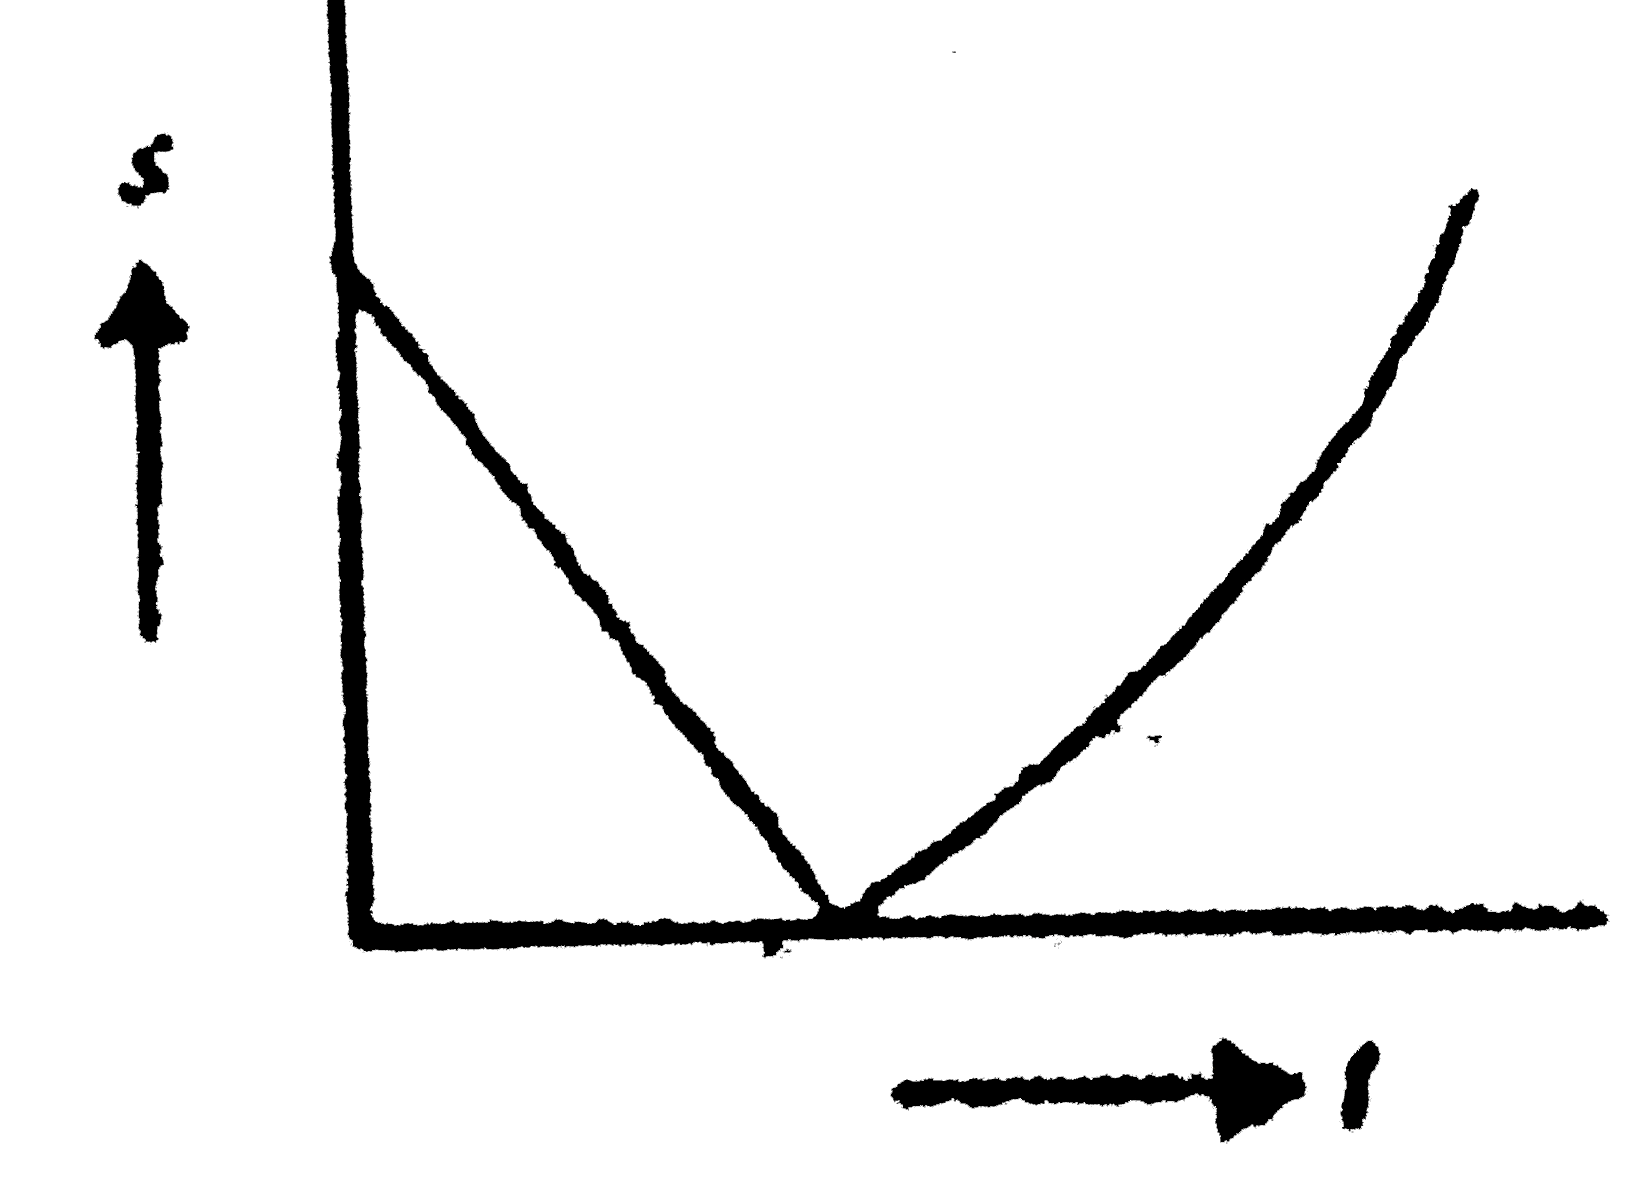
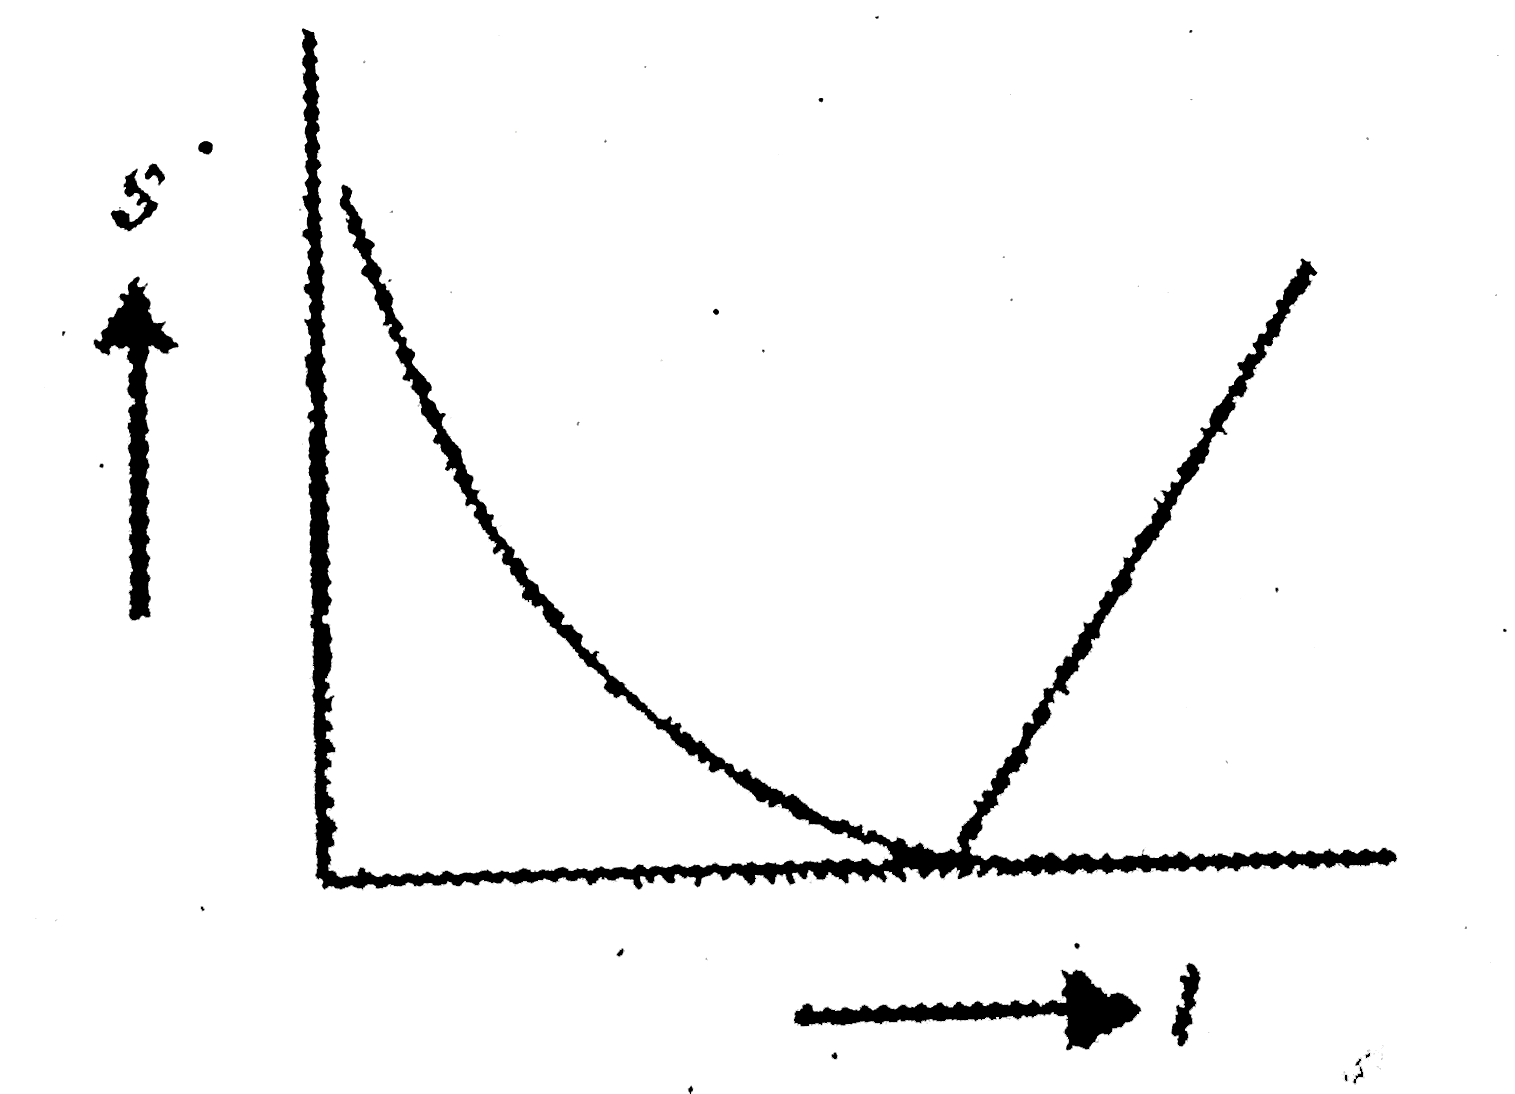
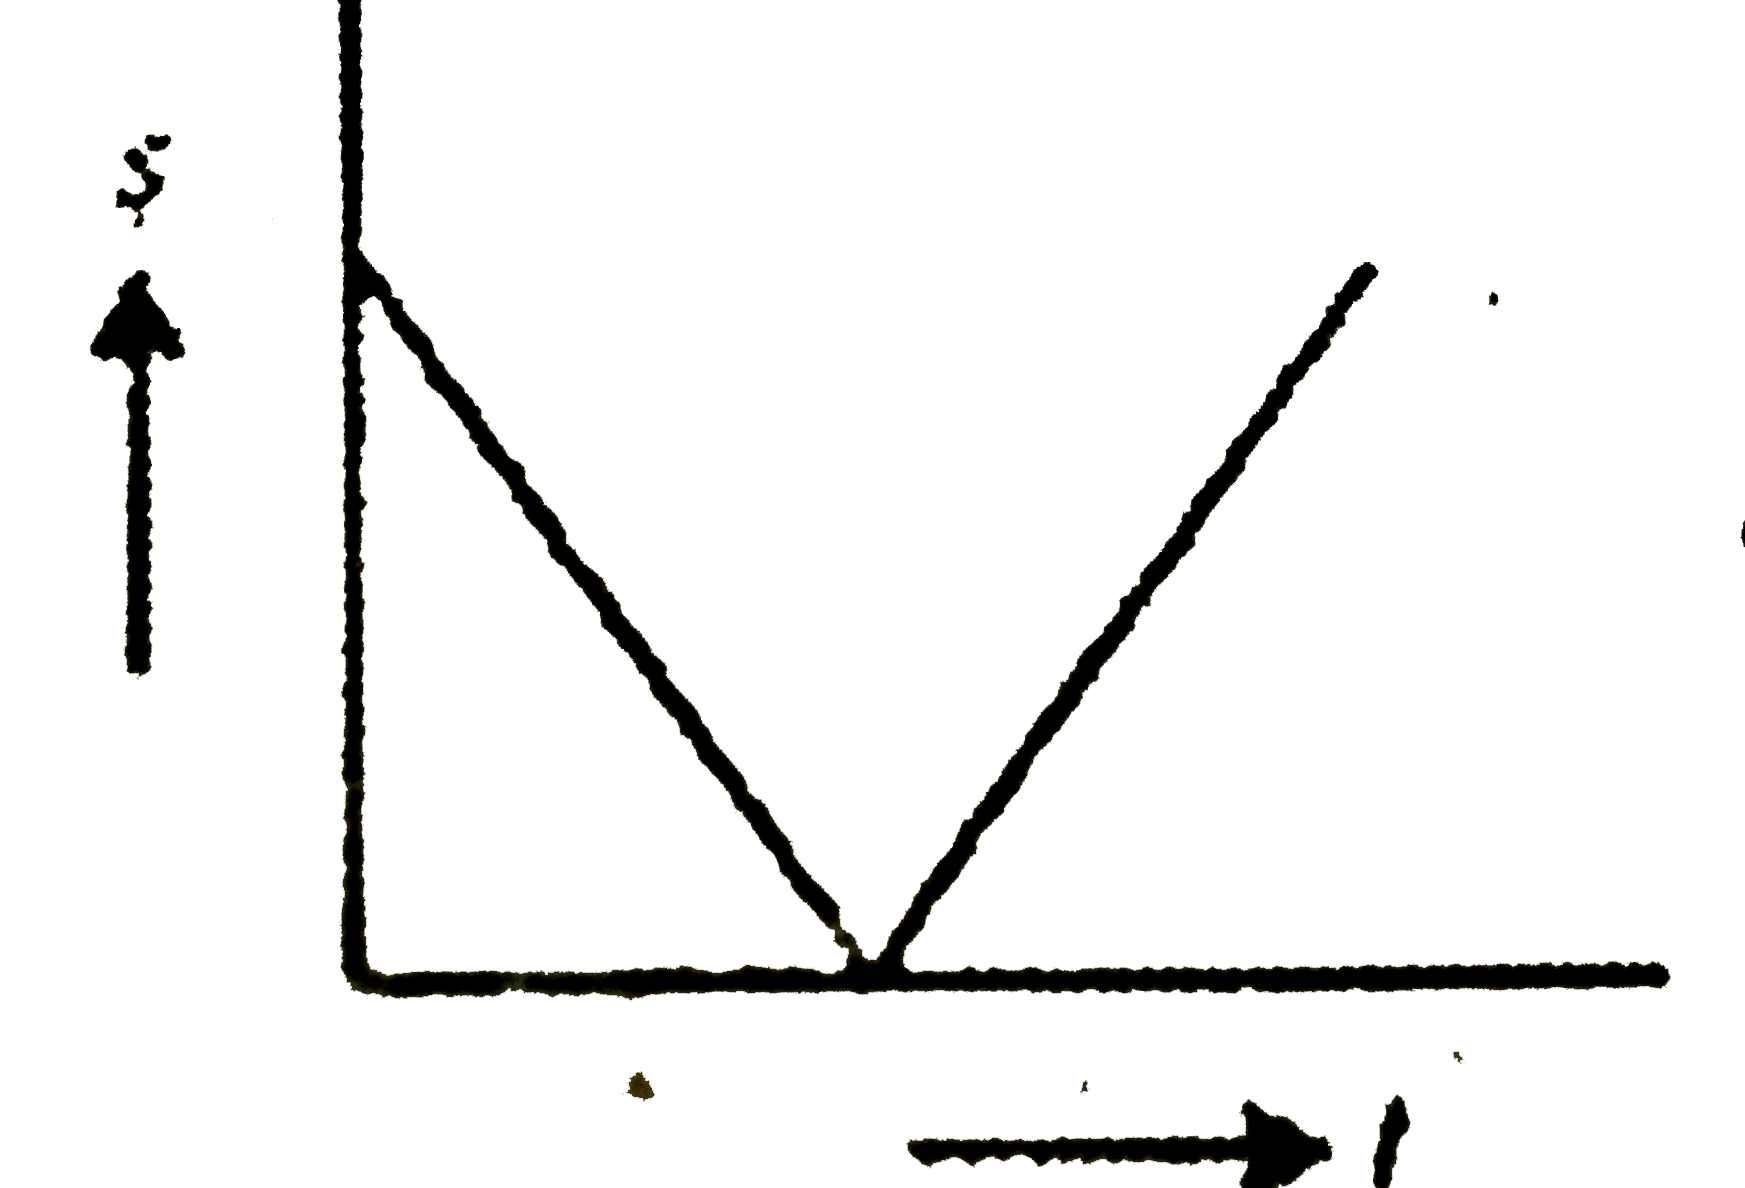
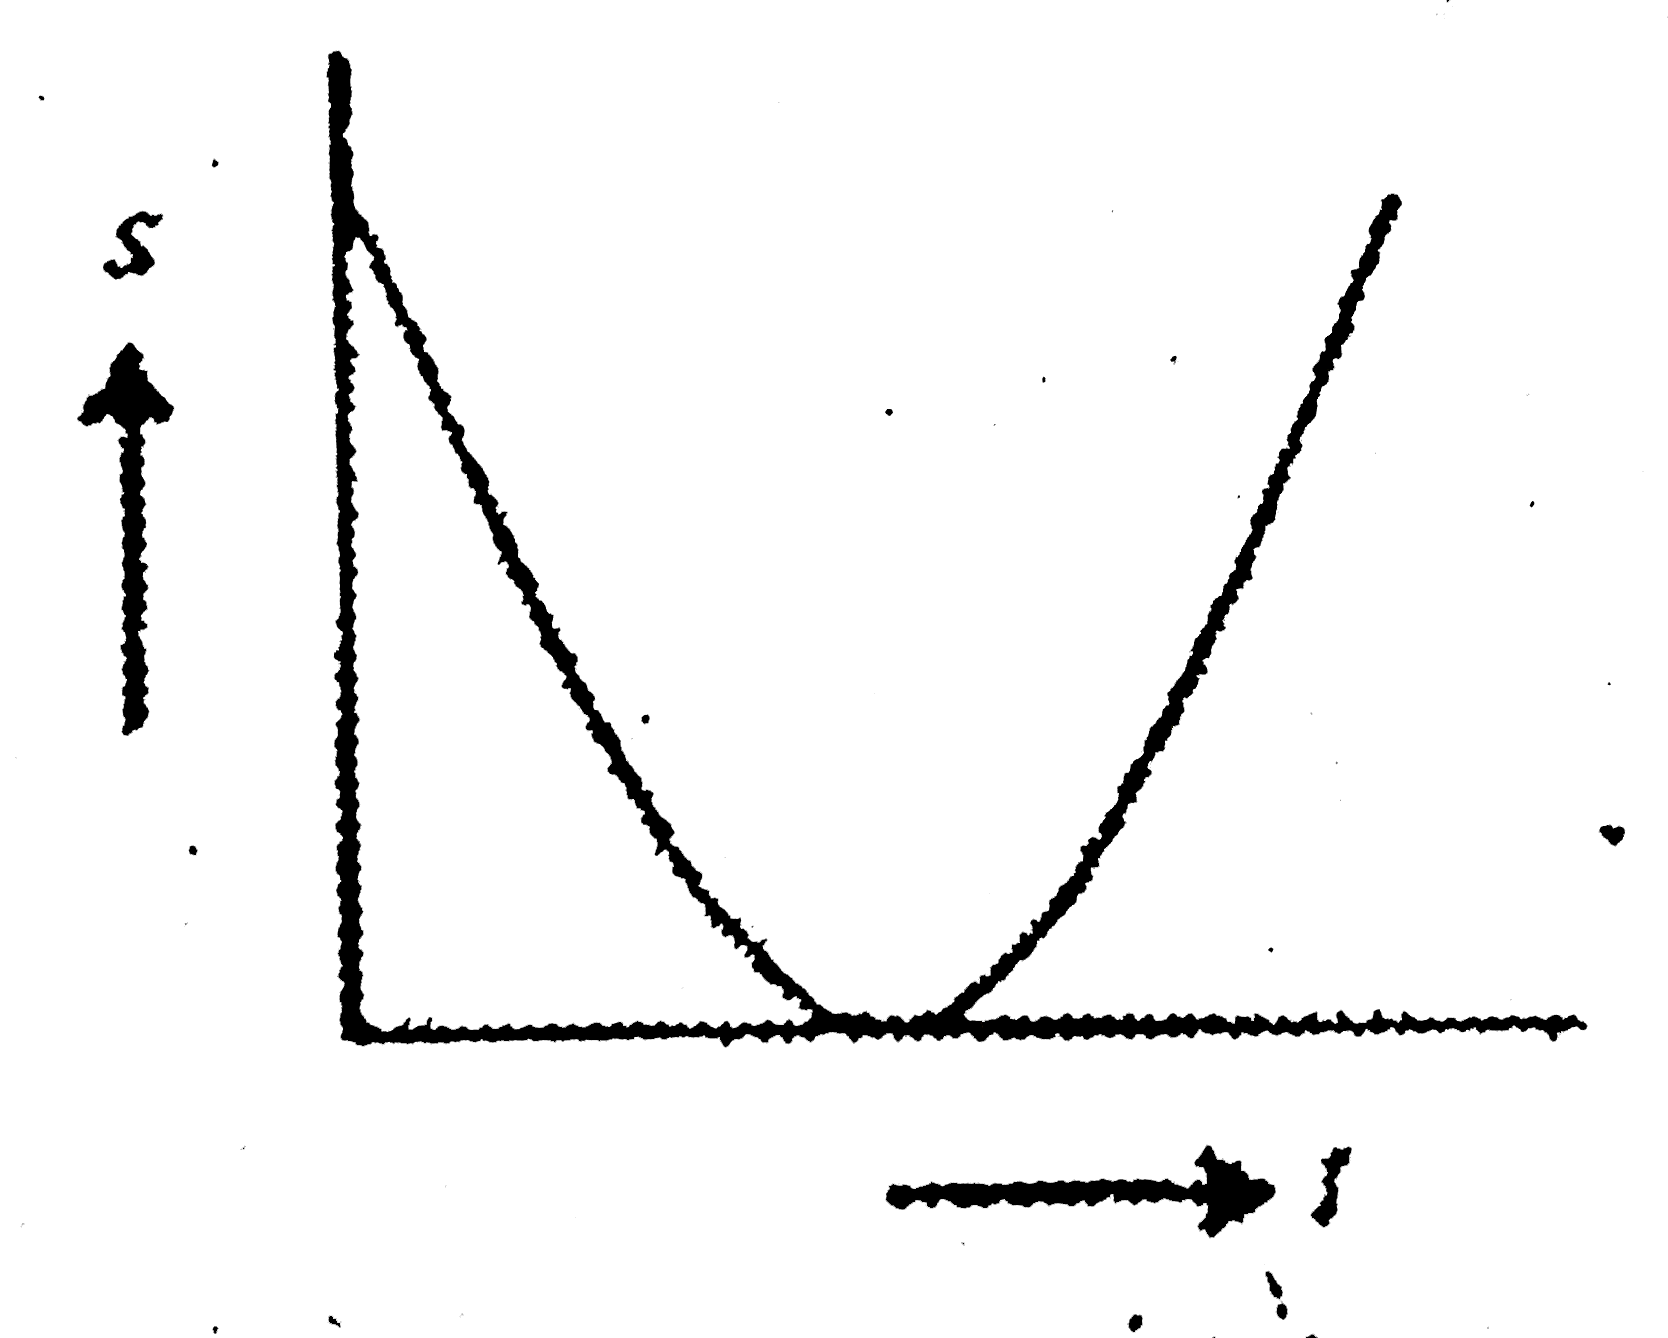
### Step 5: Sketch the Speed-Time Graph
- The graph will start at \( U \) (initial speed) and curve downwards as the ball rises, indicating a decrease in speed due to gravity and air resistance.
- At the peak, the speed will be zero.
- As the ball falls, the speed will increase but at a decreasing rate due to air resistance, resulting in a curve that rises less steeply than it would without air resistance.
### Conclusion
The speed-time graph will show a curve that decreases during the upward motion and increases during the downward motion, but the increase will be less steep than the decrease.
### Final Answer
From the options provided, the correct plot representing the speed graph of the ball during its flight, considering air resistance, is the one that shows a curved line for both upward and downward motion.
---