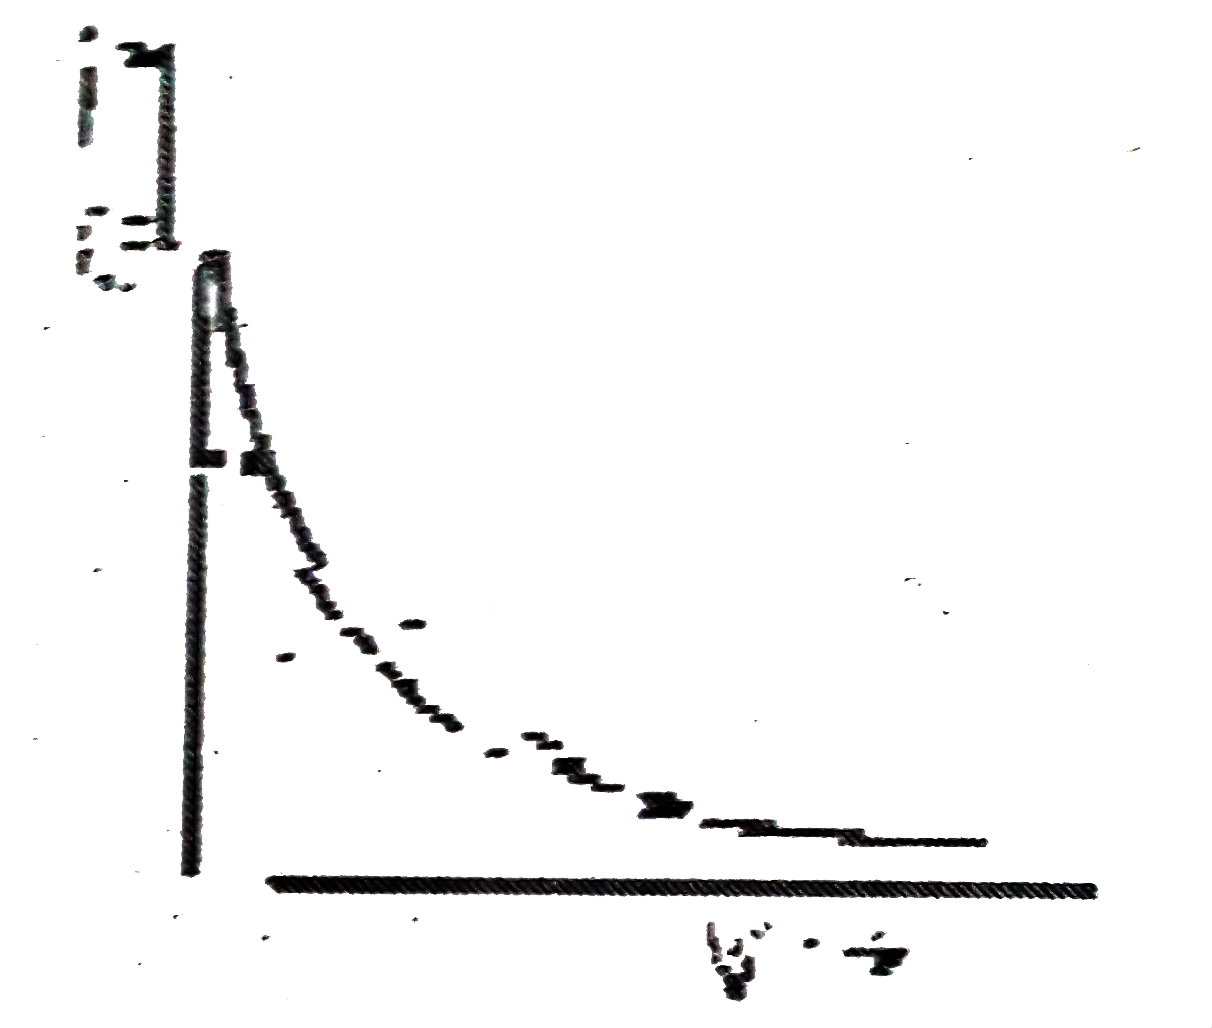
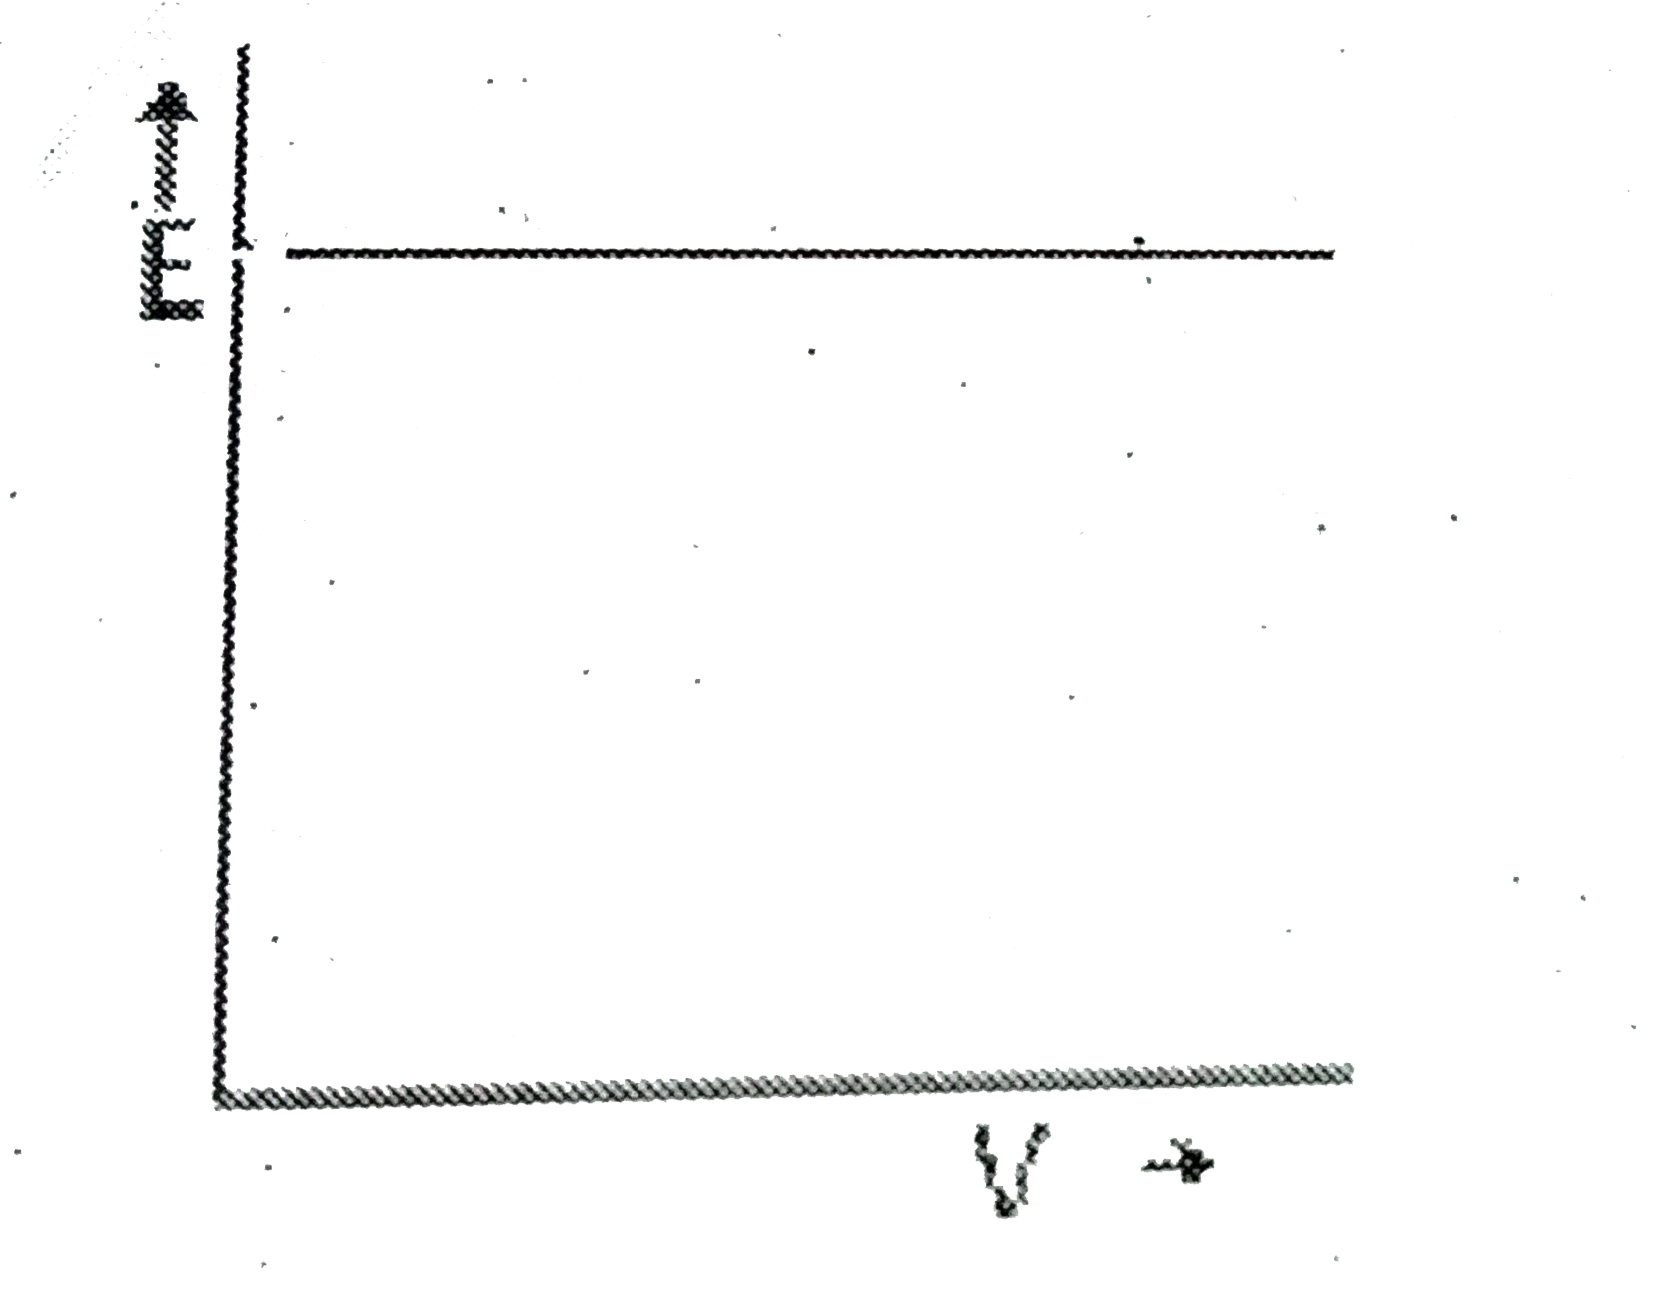
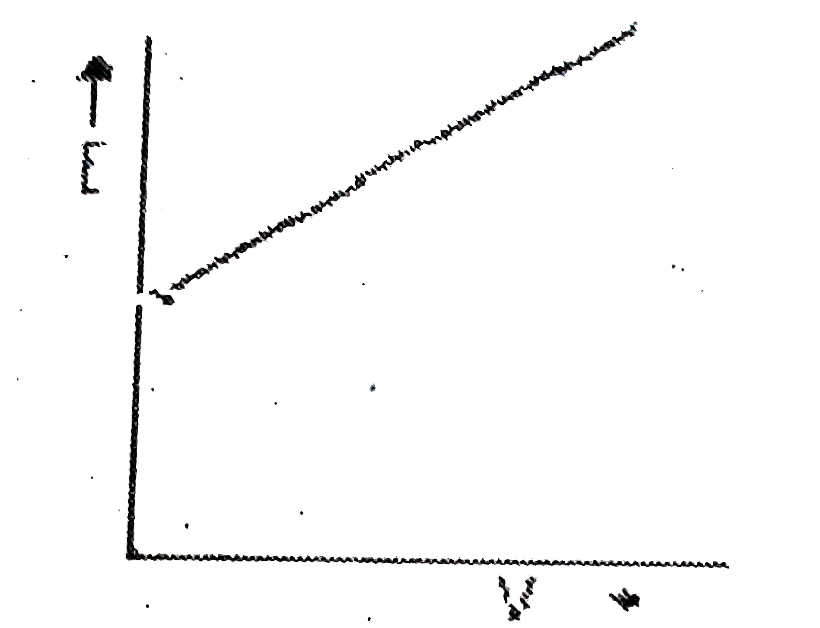
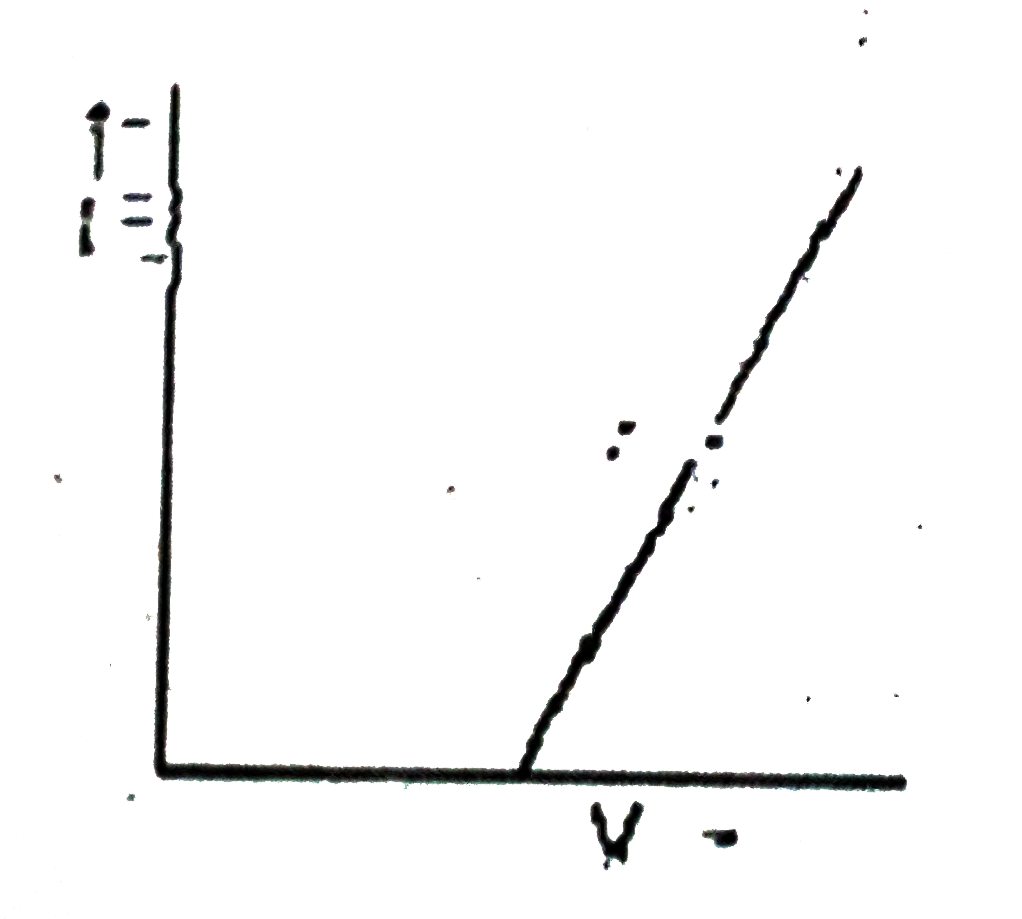
Home
Class 12
PHYSICS
The correct graph respectivley the relat...

The correct graph respectivley the relation between energy `(E )` of photoelectrons and frequency `v` of incident light is

A

B

C

D

Text Solution

AI Generated Solution

The correct Answer is:
To solve the problem of determining the correct graph that represents the relationship between the energy \( E \) of photoelectrons and the frequency \( v \) of incident light, we can follow these steps: ### Step 1: Understand the Photoelectric Effect The photoelectric effect states that when light of a certain frequency \( v \) strikes a metal surface, it can eject electrons if the energy of the incident photons is greater than the work function \( \phi \) of the metal. The energy of the photons is given by the equation: \[ E_{\text{photon}} = h v \] where \( h \) is Planck's constant. ### Step 2: Relate Photon Energy to Photoelectron Energy The energy of the emitted photoelectrons \( E \) can be expressed as: \[ E = h v - \phi \] This equation shows that the energy of the photoelectrons depends linearly on the frequency of the incident light. ### Step 3: Identify the Threshold Frequency The threshold frequency \( v_0 \) is defined as the minimum frequency of light required to eject electrons from the metal surface. At this frequency, the energy of the photons is equal to the work function: \[ h v_0 = \phi \] Thus, when \( v = v_0 \), the energy \( E \) of the emitted photoelectrons becomes zero: \[ E = h v_0 - \phi = 0 \] ### Step 4: Analyze the Graph From the equation \( E = h v - \phi \), we can deduce that: - The graph of \( E \) versus \( v \) is a straight line with a positive slope of \( h \). - The line intersects the \( E \)-axis at \( E = -\phi \) when \( v = 0 \). - The line will pass through the origin (0,0) when \( v = v_0 \). ### Step 5: Choose the Correct Graph Given the characteristics of the graph: - It should be a straight line with a positive slope. - It should intersect the frequency axis at the threshold frequency \( v_0 \) where the energy of the photoelectrons is zero. Based on these observations, the correct graph is the one that represents a linear relationship starting from the threshold frequency and having a positive slope. ### Conclusion The correct graph that represents the relationship between the energy \( E \) of photoelectrons and the frequency \( v \) of incident light is a straight line with a positive slope, starting from the point where \( E = 0 \) at the threshold frequency \( v_0 \). ---
Promotional Banner

Similar Questions

Explore conceptually related problems

According to Einstein's photoelectric equation, the graph between kinetic energy of photoelectrons ejected and the frequency of the incident radiation is :

According to Einstein's photoelectric equation , the graph between the kinetic energy of photoelectrons ejected and the frequency of incident radiation is

Maximum kinetic energy (E_(k)) of a photoelectron varies with the frequency (v) of the incident radiation as

Kinetic energy of photoelectrons is independent on-------- of incident radiation.

In an experiment of photo-electric effect, the graph of maximum kinetic energy E_(k) of the emitted photoelectrons versus the frequency v of the incident light is a straight line AB as shown in figure below : Threshold frequency of the metal.

In an experiment of photo-electric effect, the graph of maximum kinetic energy E_(k) of the emitted photoelectrons versus the frequency v of the incident light is a straight line AB as shown in figure below : Stopping potential for the photoelectrons emitted by the light of frequency v=30xx10^(14)Hz

In an experiment of photo-electric effect, the graph of maximum kinetic energy E_(k) of the emitted photoelectrons versus the frequency v of the incident light is a straight line AB as shown in figure below : Work function of the metal.

In an experiment of photoelectric effect, the graph of maximum kinetic energy E_(K) of the emitted photoelectrons versus the frequency v of the incident light is a straight line AB as shown in Figure below: Find : (i) Threshold frequency of the metal. (ii) work function of the metal (iii) Stopping potential for the photoelectrons emitted by the light of frequency v=30xx10^(14) Hz.

A graph regarding photoelectric effect is shown between the maximum kinetic energy of electrons and the frequency of the incident light. On the basis of data as shown in the graph, calculate (a) threshold frequency , (b) work- function, (c ) planck constant

The slope of the graph drawn between stopping potential and frequency of incident radiation will be