A
B
C
D
Text Solution
Verified by Experts
The correct Answer is:


Similar Questions
Explore conceptually related problems
Recommended Questions
- The current-voltage graph of a device is shown in figure. The resistan...
Text Solution
|
- The current-voltage graph of a device is shown in figure. The resistan...
Text Solution
|
- Graph showing the variation of current versus voltage for a material G...
Text Solution
|
- The current-voltage graph for a resistor is as shown in the figure. Is...
Text Solution
|
- From the given between current I and voltage V shown in figure , inden...
Text Solution
|
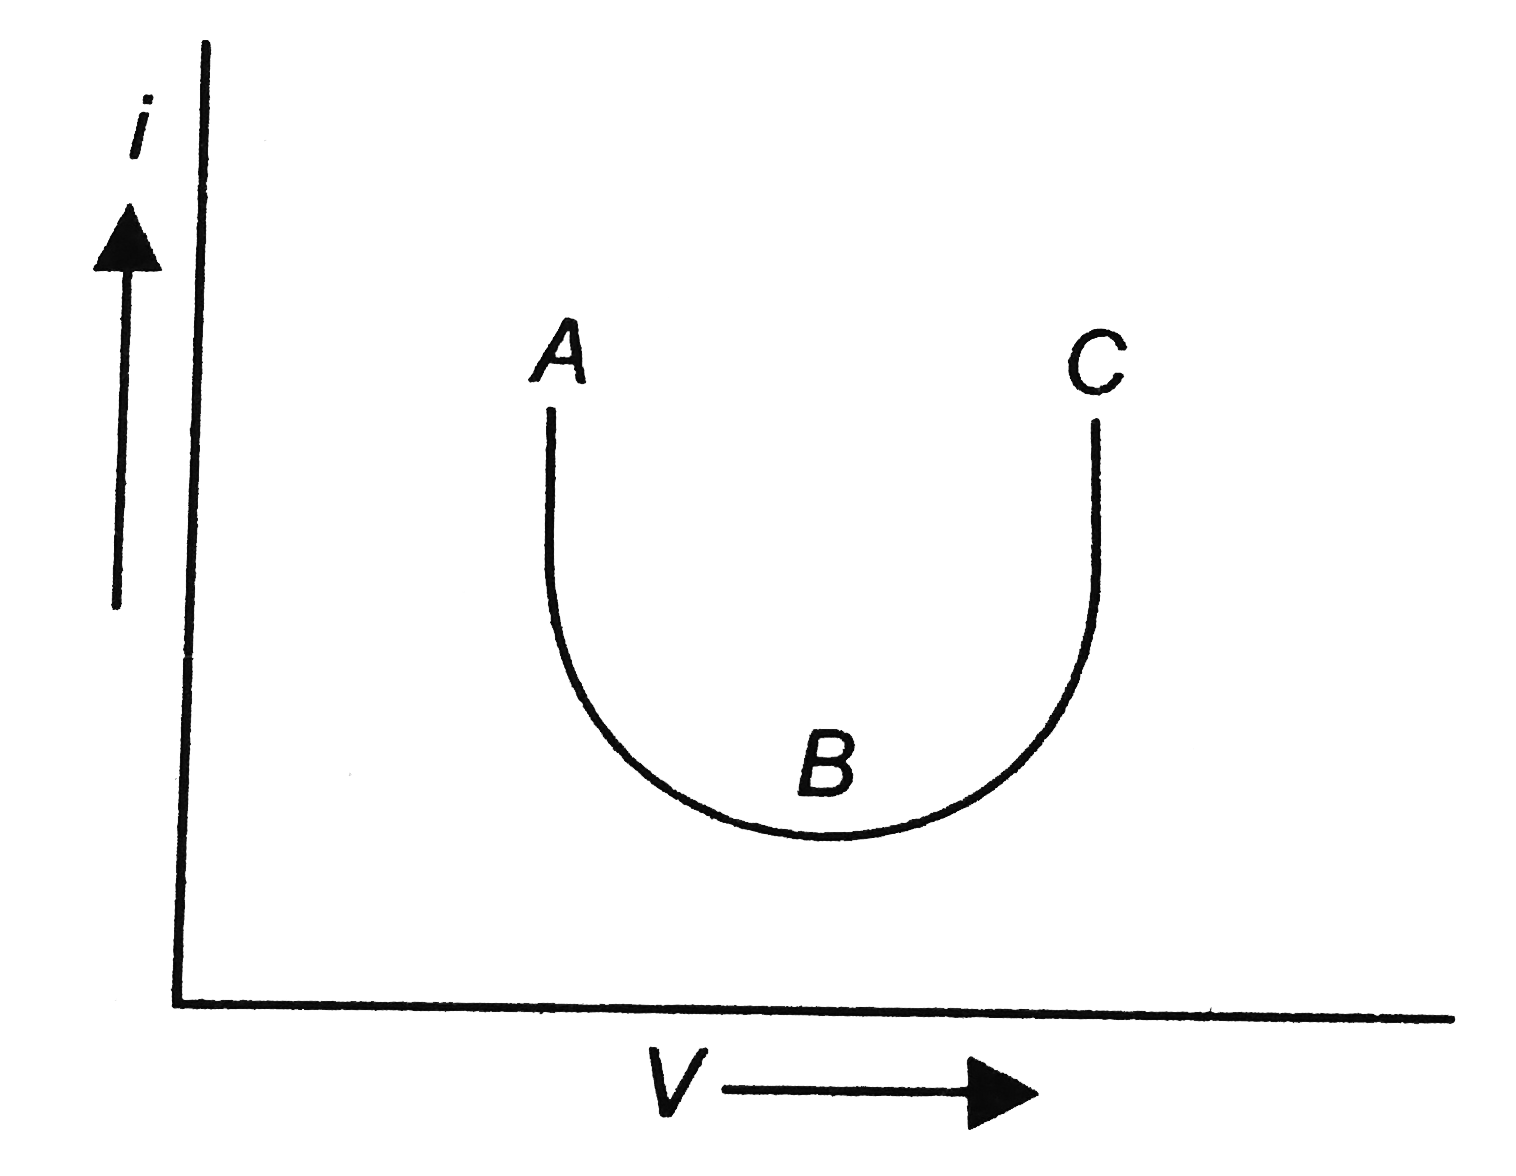
- Resistance as shown in figure is negative at
Text Solution
|
- (a) Draw graph showing the variation of current versus voltage in an e...
Text Solution
|
- Show the variation of current versus voltage graph for GaAs and mark t...
Text Solution
|
- किसी उपकरण हेतु V-I ग्राफ निम्न चित्र में प्रदर्शित है । प्रतिर...
Text Solution
|