A
B
C
D
Text Solution
AI Generated Solution


Similar Questions
Explore conceptually related problems
Recommended Questions
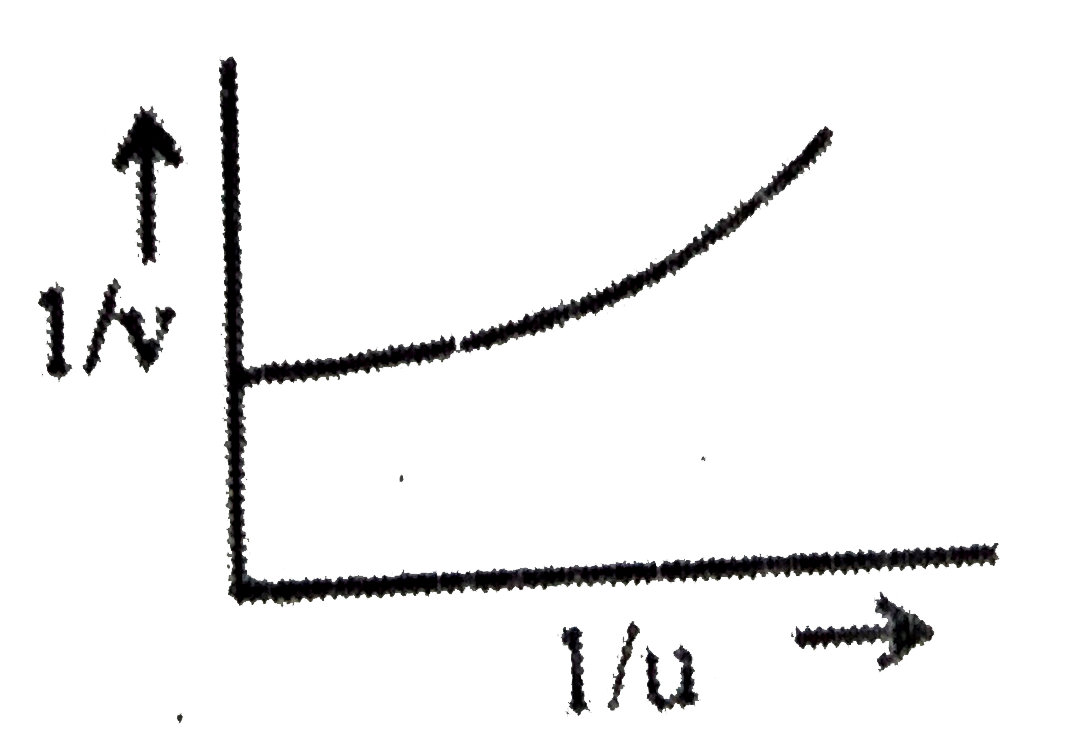
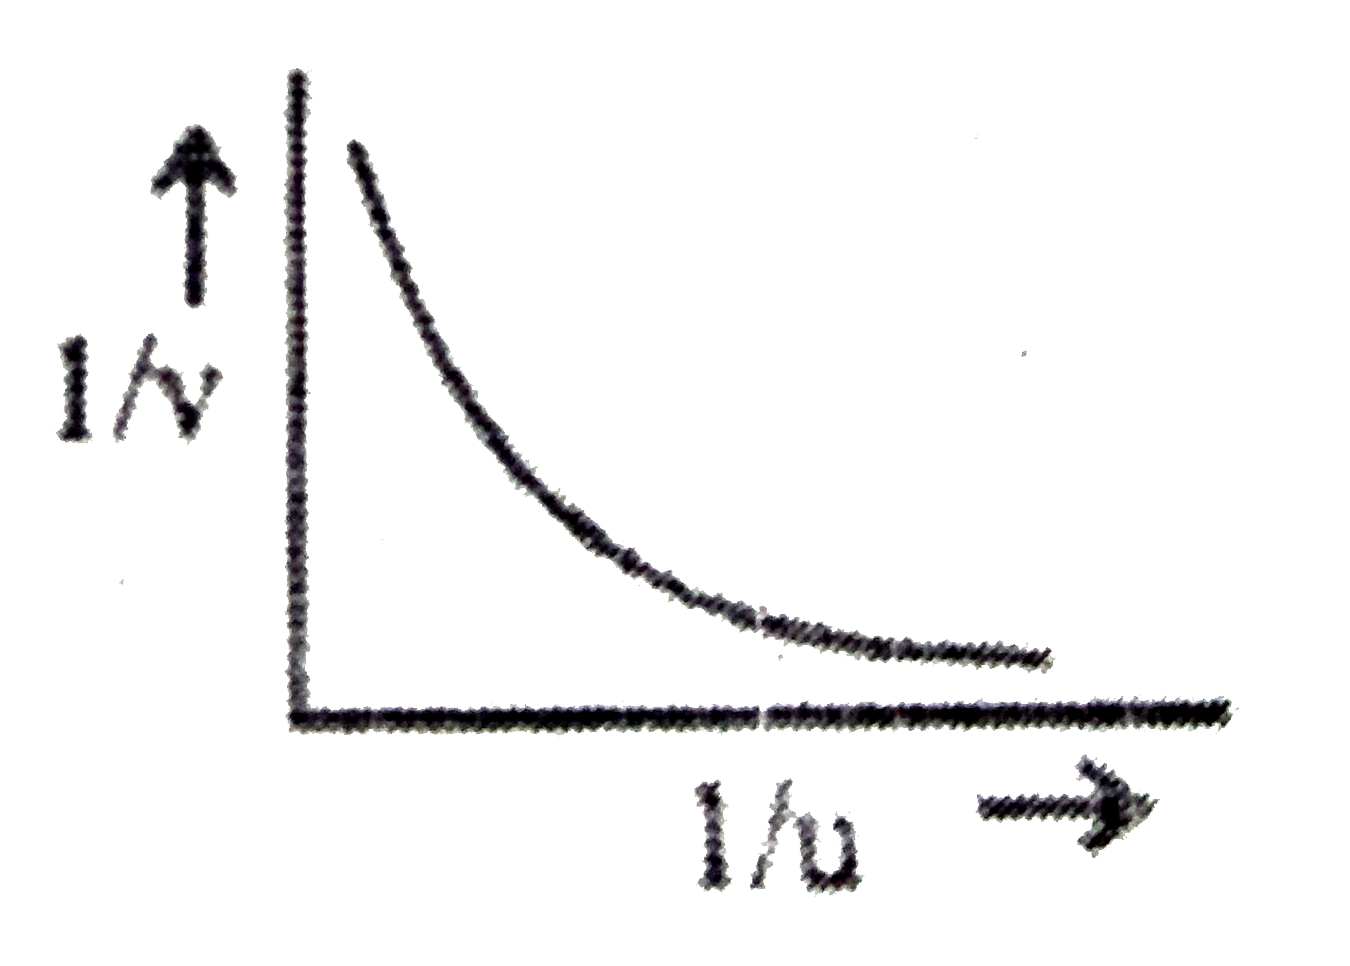
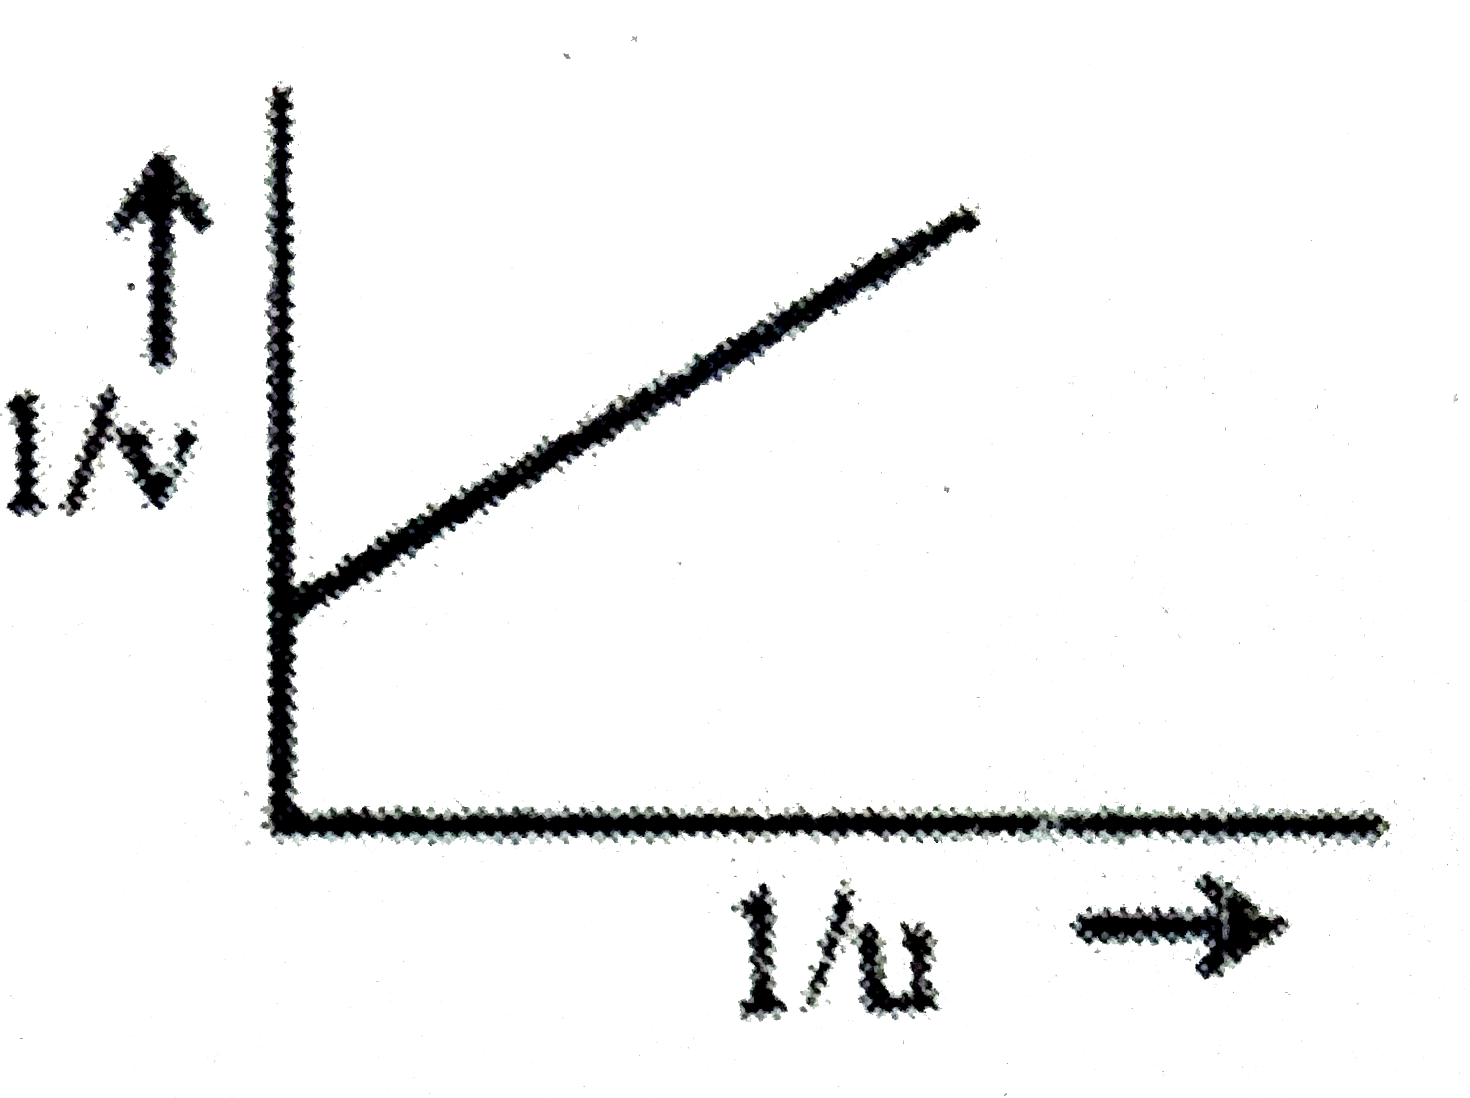
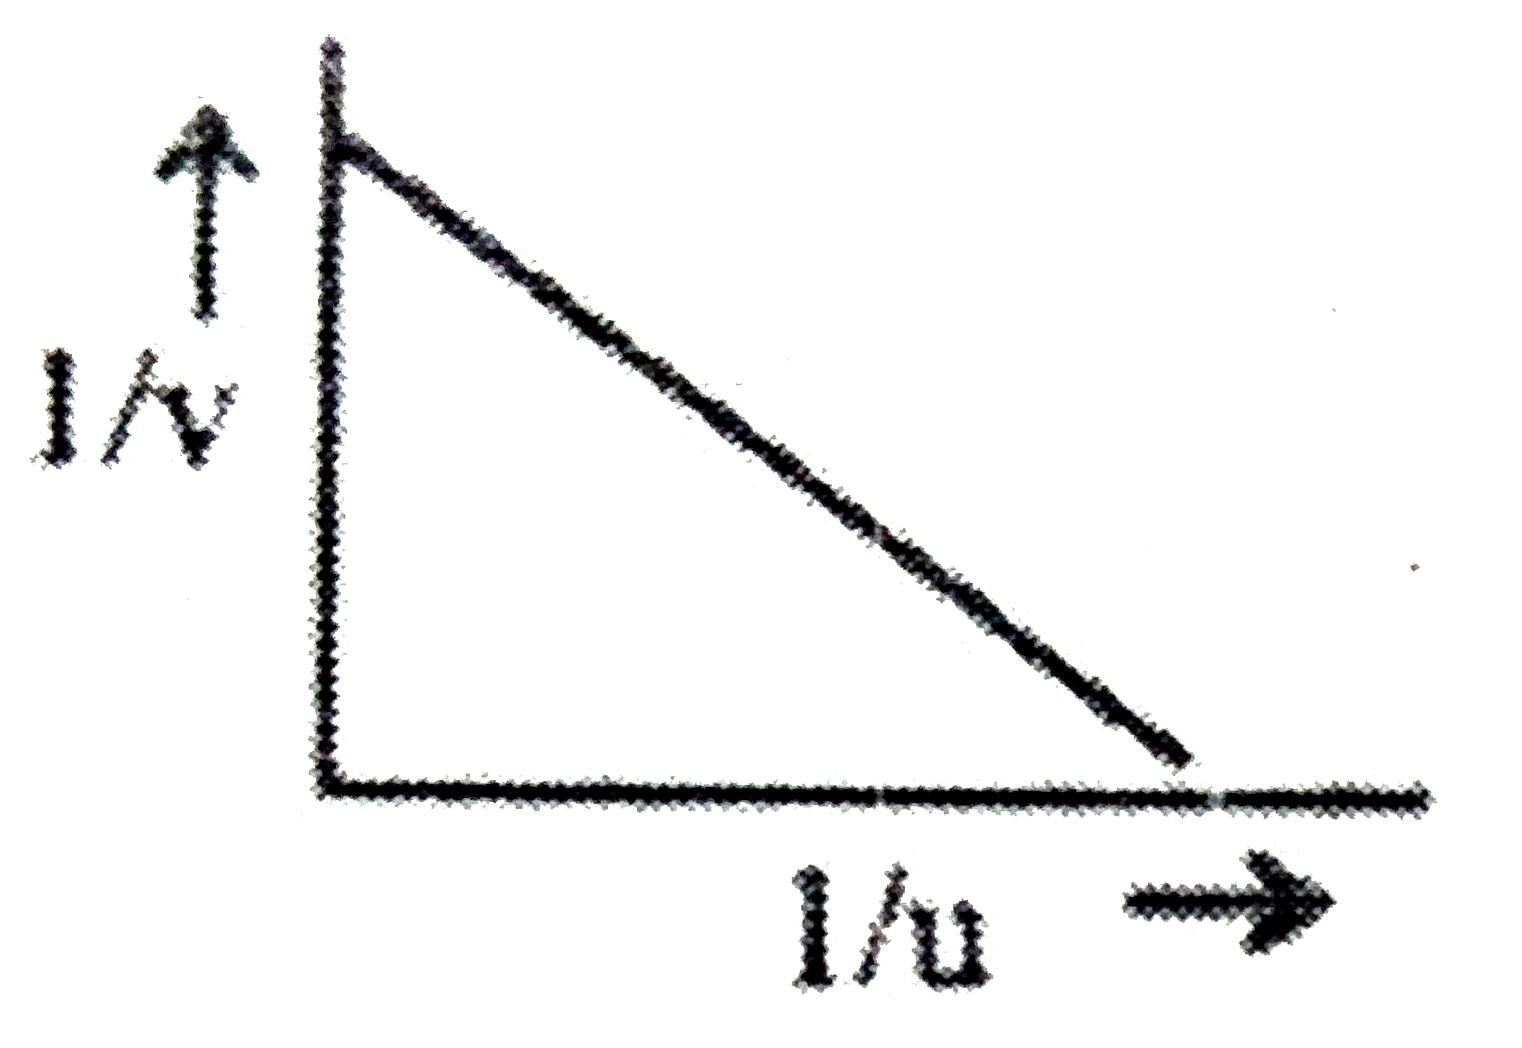
- If a graph is plotted between 1/v and 1/u , which one of the graph sho...
Text Solution
|
- The graph between (1)/(v) and (1)/(u) for a concave mirror looks like.
Text Solution
|
- Plot the graphs of |(1)/(V)| vs |(1)/(u)| where v is image distance an...
Text Solution
|
- The distance v of the real image formed by a convex lens is measured f...
Text Solution
|
- For sperical mirros graph plotted between - (1)/(V) and -(1)/(u)is .
Text Solution
|
- If a graph is plotted between 1/v and 1/u , which one of the graph sho...
Text Solution
|
- इनमें से कौन एक गोलीय सतह पर अपवर्तन के लिए (1)/(v) तथा (1)/(u) के बीच...
Text Solution
|
- गोलीय दर्पण के लिए 1/u और 1/v के बीच ग्राफ खींचिये।
Text Solution
|
- In case of a curved mirror if the distance of object "(u)" and image "...
Text Solution
|