Text Solution
Verified by Experts


Topper's Solved these Questions
MEASUREMENTS
PEARSON IIT JEE FOUNDATION|Exercise Concept Application (LEVEL 3)|10 VideosMEASUREMENTS
PEARSON IIT JEE FOUNDATION|Exercise Assessment Test (Test 1)|15 VideosMEASUREMENTS
PEARSON IIT JEE FOUNDATION|Exercise Concept Application (LEVEL 1) (Match the Column)|3 VideosMACHINES AND TOOLS
PEARSON IIT JEE FOUNDATION|Exercise CONCEPT APPLICATION (LEVEL 2)|12 VideosMOCK TEST
PEARSON IIT JEE FOUNDATION|Exercise MULTIPLE CHOICE QUESTION|25 Videos
Similar Questions
Explore conceptually related problems
PEARSON IIT JEE FOUNDATION-MEASUREMENTS-Concept Application (LEVEL 2)
- In a particular scale A, one metreis divided into 500equal parts and i...
Text Solution
|
- A wire is wound over a pencil and placed over a scale as shown in the ...
Text Solution
|
- If the radius of a sphere is doubled, then the density of the sphere ...
Text Solution
|
- A paper cutting is placedon a graph as shownin the figure, each on he ...
Text Solution
|
- The mass of an empty density bottle is 50 g. When it is completely fil...
Text Solution
|
- The density of the solid cylindrical bar shown in the figure is 5xx 10...
Text Solution
|
- The readings in a graduated cylinder are10 cm^(3) and 20 cm^(3), respe...
Text Solution
|
- A stock of identical coins are placed on a scale as shown in the figur...
Text Solution
|
- If the density of a sphere is reduced to 1//8 of its original value, t...
Text Solution
|
- A paper cutting is placed on a graph a as shown in the figure, each di...
Text Solution
|
- Density of the material of a paper is o.4g cm^(-3).The mass of the pap...
Text Solution
|
- If the length, breadth and height of a cuboid are all increased to 'n'...
Text Solution
|
- A wooden block is tied to a metallic rod of mass 100 g and immersed co...
Text Solution
|
- A student was given a task to find the destiny of a cube whose mass an...
Text Solution
|
- A physics student was given a 400 pages book and a metre scale and ask...
Text Solution
|
- A wire wound over a rod and placed over a scale, as shown in figure. C...
Text Solution
|
- A student took a spring balance calibrated in gf. He then suspended an...
Text Solution
|
- A physics scholar took two spring balances S(1) and S(2) that are cali...
Text Solution
|
- A scientist took a physical balance and an object of weight 10 kgwt fr...
Text Solution
|
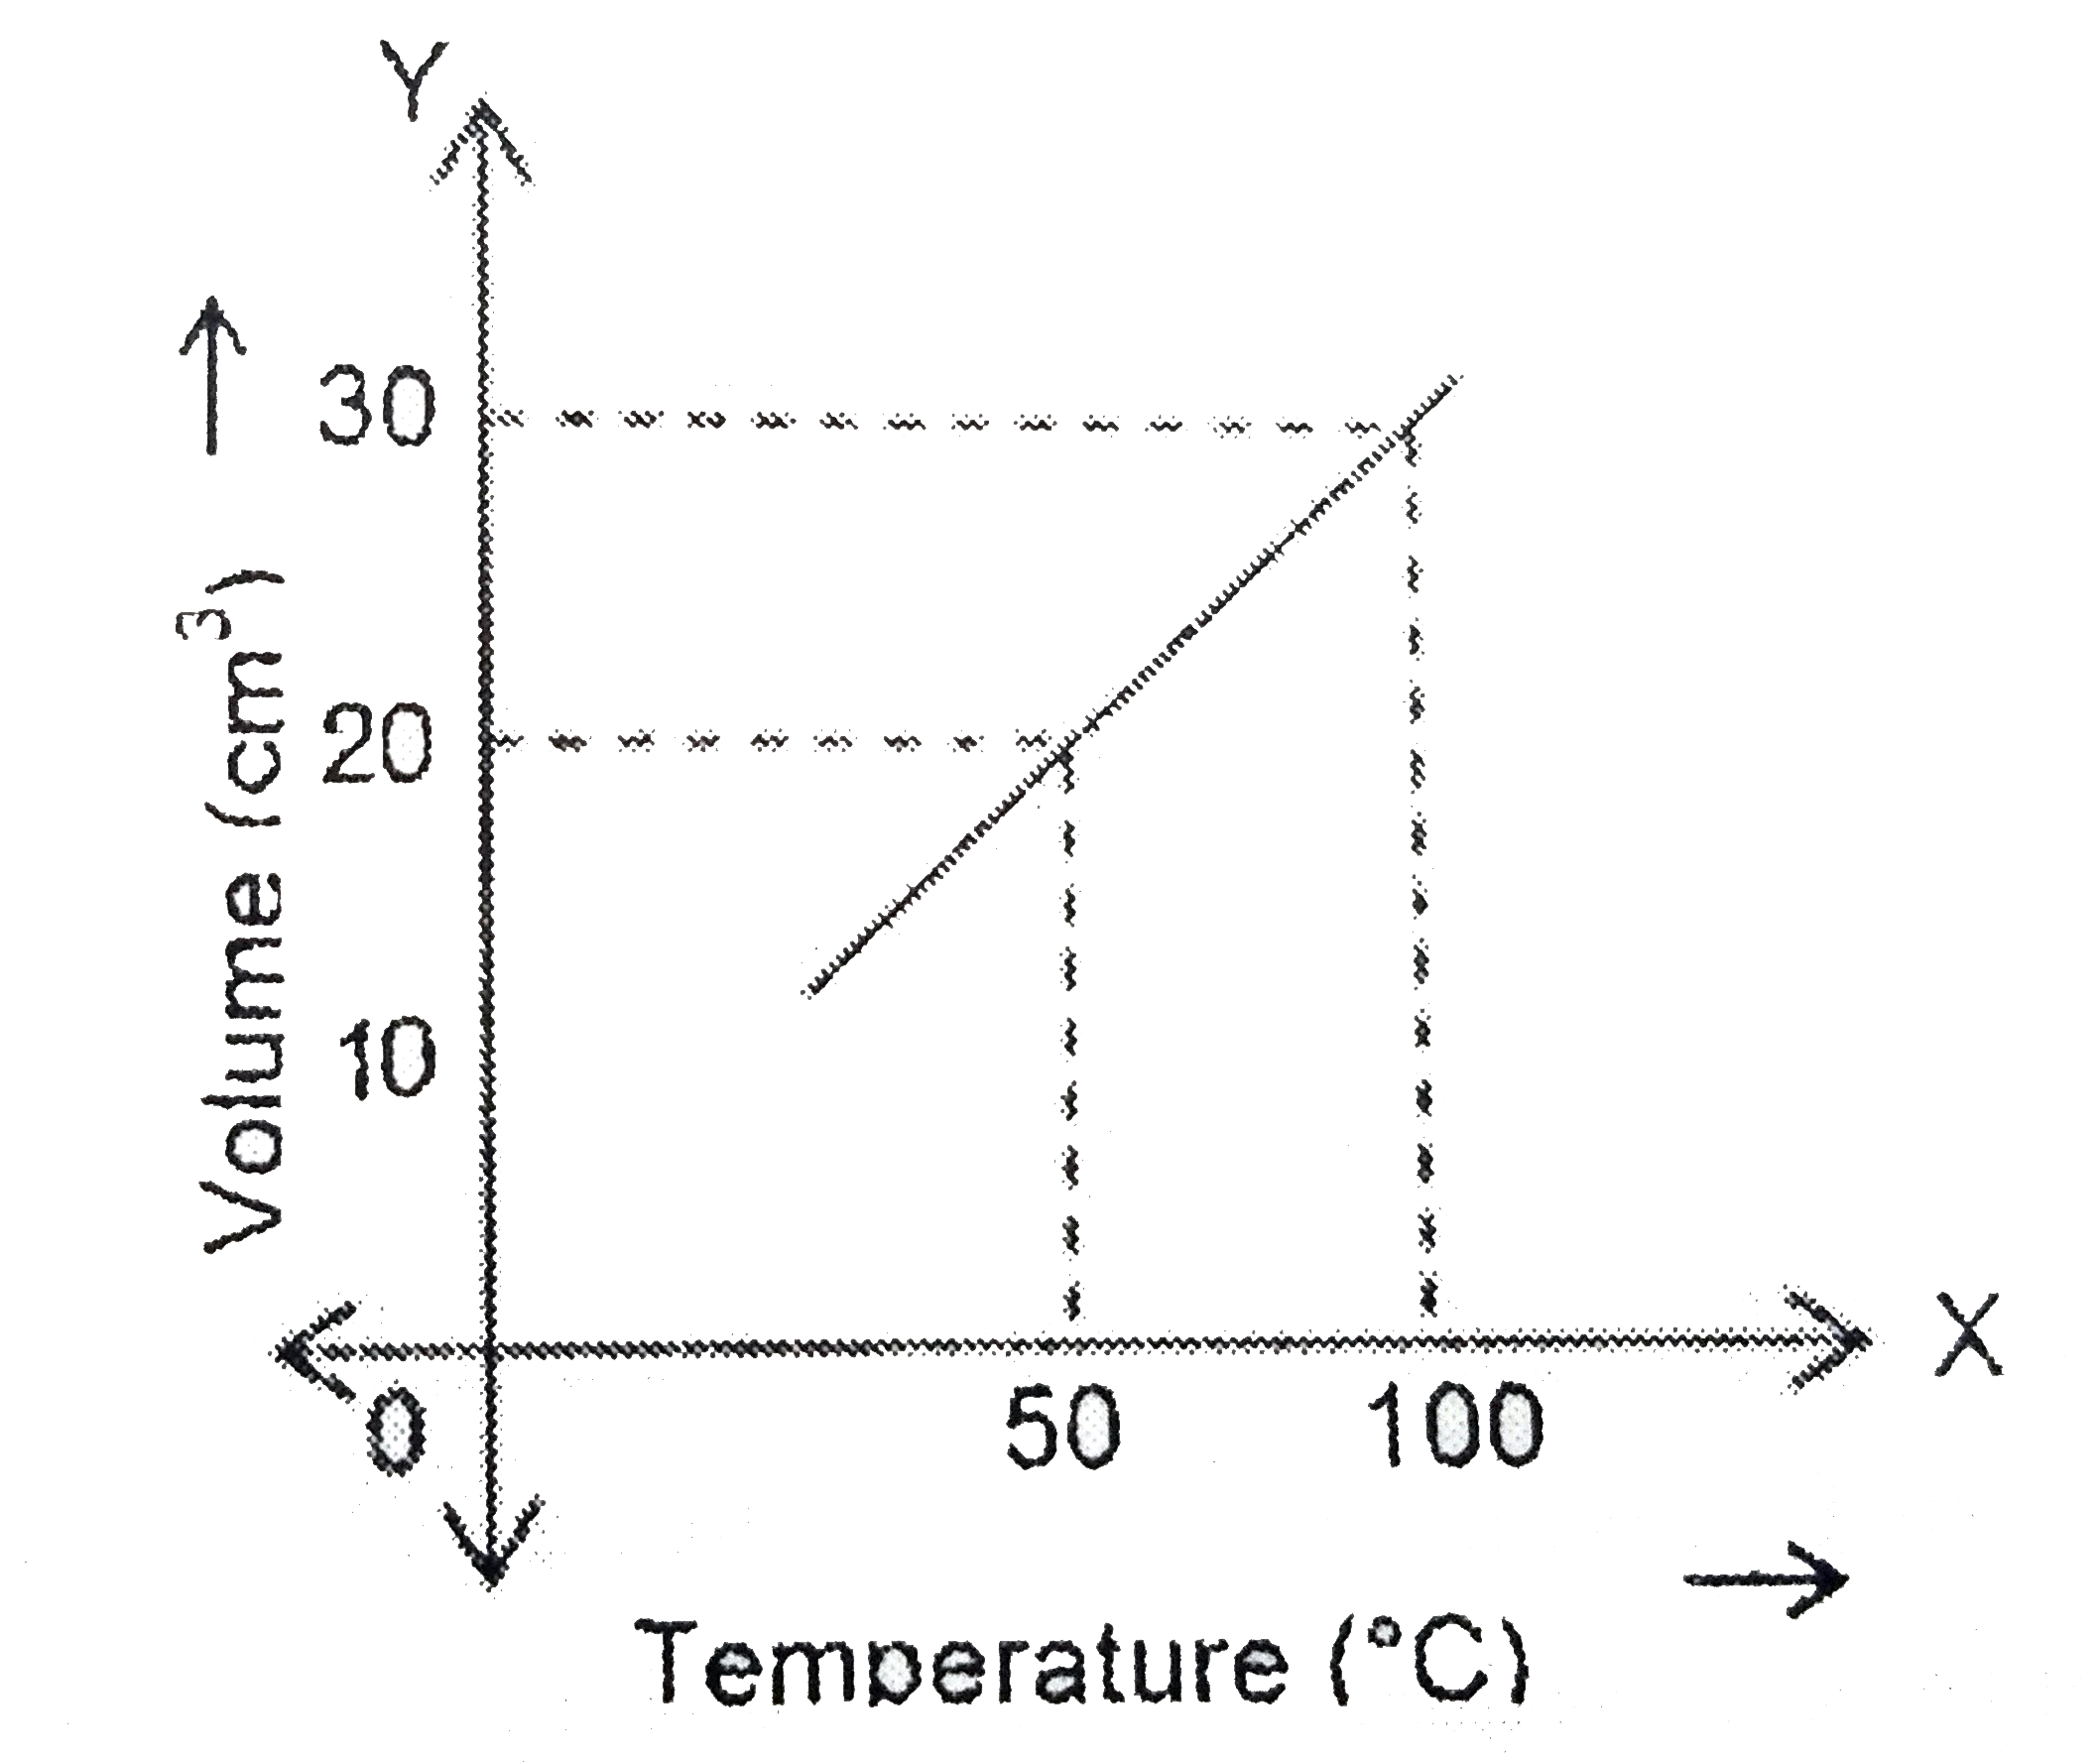
- The change in volume of a gas with change in temperature is plotted on...
Text Solution
|