Home
Class 7
PHYSICS
The change in volume of a given mass of ...

The change in volume of a given mass of gas with the temperature is graphically represented as shown in the figure shown below. Determine the ratio of densities of the gas at `100^(@)C and 150^(@)C`.

A

`(4)/(3)`

B

`(3)/(4)`

C

`(3)/(5)`

D

`(1)/(3)`

Text Solution

Verified by Experts

The correct Answer is:
A

Density `=("mass")/("volume")`
`=(d_(1))/(d_(2))=(v1)/((m2)/(v2))=(v_(2))/(v_(1))=(40)/(30)=(4)/(3)`
Hence the correct option is (b).
Promotional Banner

Topper's Solved these Questions

  • MEASUREMENTS

    PEARSON IIT JEE FOUNDATION|Exercise Assessment Test (Test 2)|14 Videos
  • OUR UNIVERSE

    PEARSON IIT JEE FOUNDATION|Exercise ASSESSMENT TEST (TEST 2)|14 Videos

Similar Questions

Explore conceptually related problems

The change in volume of a gas with change in temperature is plotted on a graph, as shown in he figure. Calculate the ratio of density at 50 ^(@)C and 100 ^(@)C

For a given mass of gas the variation of pressure versus temperature is shown in the figure. What is the ratio of volume of the gas at points A and B. .

The variation of pressure with volume of the gas at different temperatures can be graphically represented as shown in figure. On the basis of this graph answer the following question. (i) How will the volume of a gas change if its pressure is increased at constant temperature ? (ii) At a constant pressure, how will the volume of a gas change if the temperature is increased from 200 K to 400 K ?

The percentage change in the volume of the given mass of a gas at constant temperature is 50% (increases). Calculate the percentage change in the presure of the gas.

The variation of pressure with volume of the gas at different temperatures can be graphically represented as shown in figure. On the basis of this graph answer the following questions. How will the volume of a gas change if its pressure is increased at constant temperature?

The variation of pressure with volume of the gas at different temperatures can be graphically represented as shown in figure. On the basis of this graph answer the following questions. At a constant pressure, how will the volume of a gas change if the temperature is increased from 200 K to 400 K?

Pressure versus density graph of an ideal gas is shown in figure

The ednsity (rho) of an ideal gas varies with temperature T as shown in figure. Then

The volume-temperature graphs of a given mass of an ideal gas at constant pressure are shown below. What is the correct order of pressure ?

PEARSON IIT JEE FOUNDATION-MOCK TEST-MULTIPLE CHOICE QUESTION
  1. An atlas of a river is shown in the figure given below. Here, the rive...

    Text Solution

    |

  2. A pile of identical coins is placed on a scale (as shown below) to mea...

    Text Solution

    |

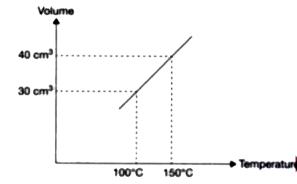
  3. The change in volume of a given mass of gas with the temperature is gr...

    Text Solution

    |

  4. The distance- time graph for the motion of three vechicles,A , B and C...

    Text Solution

    |

  5. A robot runs forward with 5 ms for 10 s and immediately backwards with...

    Text Solution

    |

  6. Which among the following is correct?

    Text Solution

    |

  7. Heat flows from one end of a steel spoon to the other end by

    Text Solution

    |

  8. If 0.5"cal" g^(-1) C^(-1) is the specific heat capacity of a substance...

    Text Solution

    |

  9. The kinetic energy of a body of mass 'm' moving with a speed 'v' is gi...

    Text Solution

    |

  10. Write the following steps in sequential order to determine the radius ...

    Text Solution

    |

  11. A light ray is made to incident on a mirror. If the glancing angle of ...

    Text Solution

    |

  12. A light ray incidents at an angle 30^(@) on a plane mirror and undergo...

    Text Solution

    |

  13. The distance between the principal focus and centre of curvature of th...

    Text Solution

    |

  14. Match the statements of Column A with those of Column B.

    Text Solution

    |

  15. Rearrange the following steps of an experiment in sequential order to ...

    Text Solution

    |

  16. Three identical cells of e.m.f. 1.5 V are connected in parallel. The t...

    Text Solution

    |

  17. How many units of electrical energy would a 2000 W electrical applianc...

    Text Solution

    |

  18. The gravitational force of attraction between two celestial bodies is ...

    Text Solution

    |

  19. Assertion (A): The loudness of sound produced by the vibrating body ca...

    Text Solution

    |

  20. A leveller with one metre long metal strip is used to level the surfac...

    Text Solution

    |