Text Solution
Verified by Experts


Topper's Solved these Questions
KARNATAKA II PUC APRIL 2020 CLASS -XII
OSWAAL PUBLICATION|Exercise PART-B (Answer any five of the following questions:)|8 VideosKARNATAKA II PUC APRIL 2020 CLASS -XII
OSWAAL PUBLICATION|Exercise PART-C (Answer any five of the following questions:)|8 VideosII PUC MARCH-2018
OSWAAL PUBLICATION|Exercise PART-D|11 VideosMAGNETISM & MATTER
OSWAAL PUBLICATION|Exercise TOPIC-2 Magnetism ( Short Answer Type questions-II)|3 Videos
Similar Questions
Explore conceptually related problems
OSWAAL PUBLICATION-KARNATAKA II PUC APRIL 2020 CLASS -XII-PART-D (Answer any three of the following questions:)
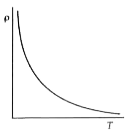
- Plot a graph of resistivity of a semiconductor as a function of absolu...
Text Solution
|
- Two point charges q(A)= 5mu C and q(B)= -5muC are located at A and B s...
Text Solution
|
- (a) Three resistors 3Omega, 4Omega, and 12Omega are connected in paral...
Text Solution
|
- A series LCR circuit contains a pure inductor of inductance 5.0H, a ca...
Text Solution
|
- At what angle should a ray of light be incident on the face of a prism...
Text Solution
|
- A copper coin has a mass of 63.0g. Calculate the nuclear energy that w...
Text Solution
|