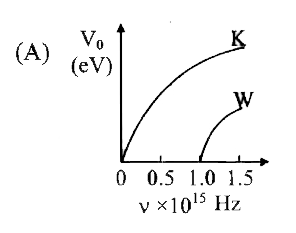
A
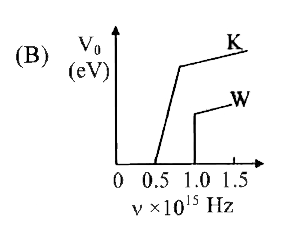
B
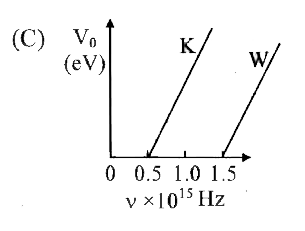
C
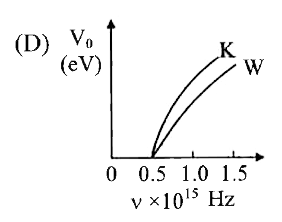
D
Text Solution
Verified by Experts
The correct Answer is:


Similar Questions
Explore conceptually related problems
Recommended Questions
- Choose the graph showing the correct relationship between the stopping...
Text Solution
|
- Assertion: If frequency of incident light is doubled, the stopping pot...
Text Solution
|
- The threshold frequency for a certain photosensitive metal is v0 . Whe...
Text Solution
|
- The figure showing the correct relationship between the stopping poten...
Text Solution
|
- Choose the correct option for the graph between the frequency of incid...
Text Solution
|
- Which of the following is the graph between the frequency (v) of the i...
Text Solution
|
- In photoelectric effect the slope of straight line graph between stopp...
Text Solution
|
- Choose the graph showing the correct relationship between the stopping...
Text Solution
|
- Draw a graph to show the dependence of stopping potential on the frequ...
Text Solution
|