A
B
C
D
Text Solution
Verified by Experts
The correct Answer is:


Similar Questions
Explore conceptually related problems
Recommended Questions
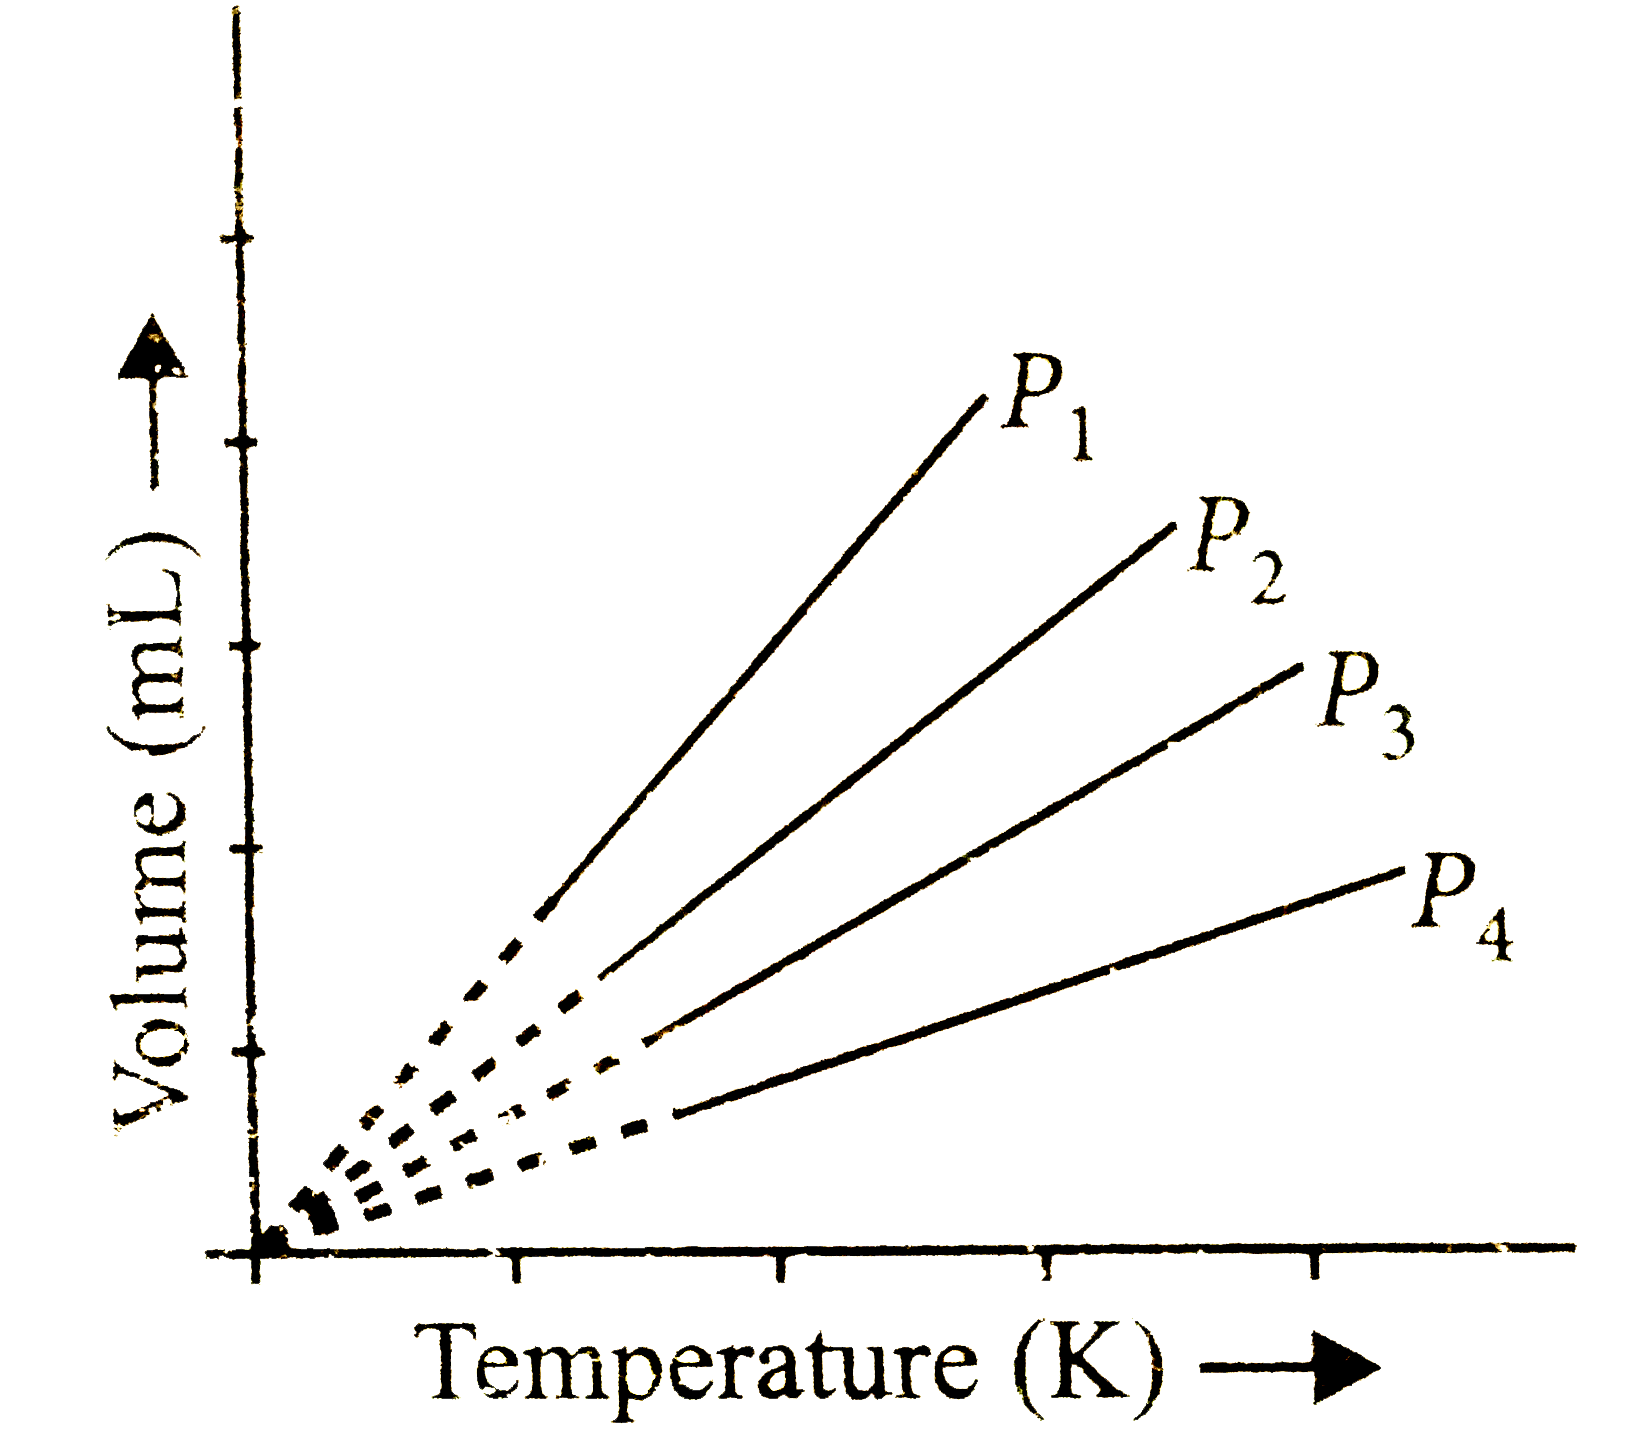
- A plot of volume (V) versus temperature (T) for a gas at constant pres...
Text Solution
|
- In the following sketch three constant pressure lines are plotted on T...
Text Solution
|
- Pressure versus temperature graph of an ideal gas of equal number of m...
Text Solution
|
- Pressure versus temperature graph of an ideal gas at constant volume V...
Text Solution
|
- A plot of volume (V) versus temperature (T) for a gas at constant pres...
Text Solution
|
- The plot of volume versus pressure at constant temperature is a…………………...
Text Solution
|
- The plot of pressure (P) versus temperature (T) for an ideal gas will ...
Text Solution
|
- Compressibility factor (Z) is plotted against pressure at different te...
Text Solution
|
- नियत दाब पर किसी गैस के लिए आयतन (V) व तापमान (T) के मध्य आरेख, मूल बि...
Text Solution
|