A
B
C
D
Text Solution
Verified by Experts
The correct Answer is:


Similar Questions
Explore conceptually related problems
Recommended Questions
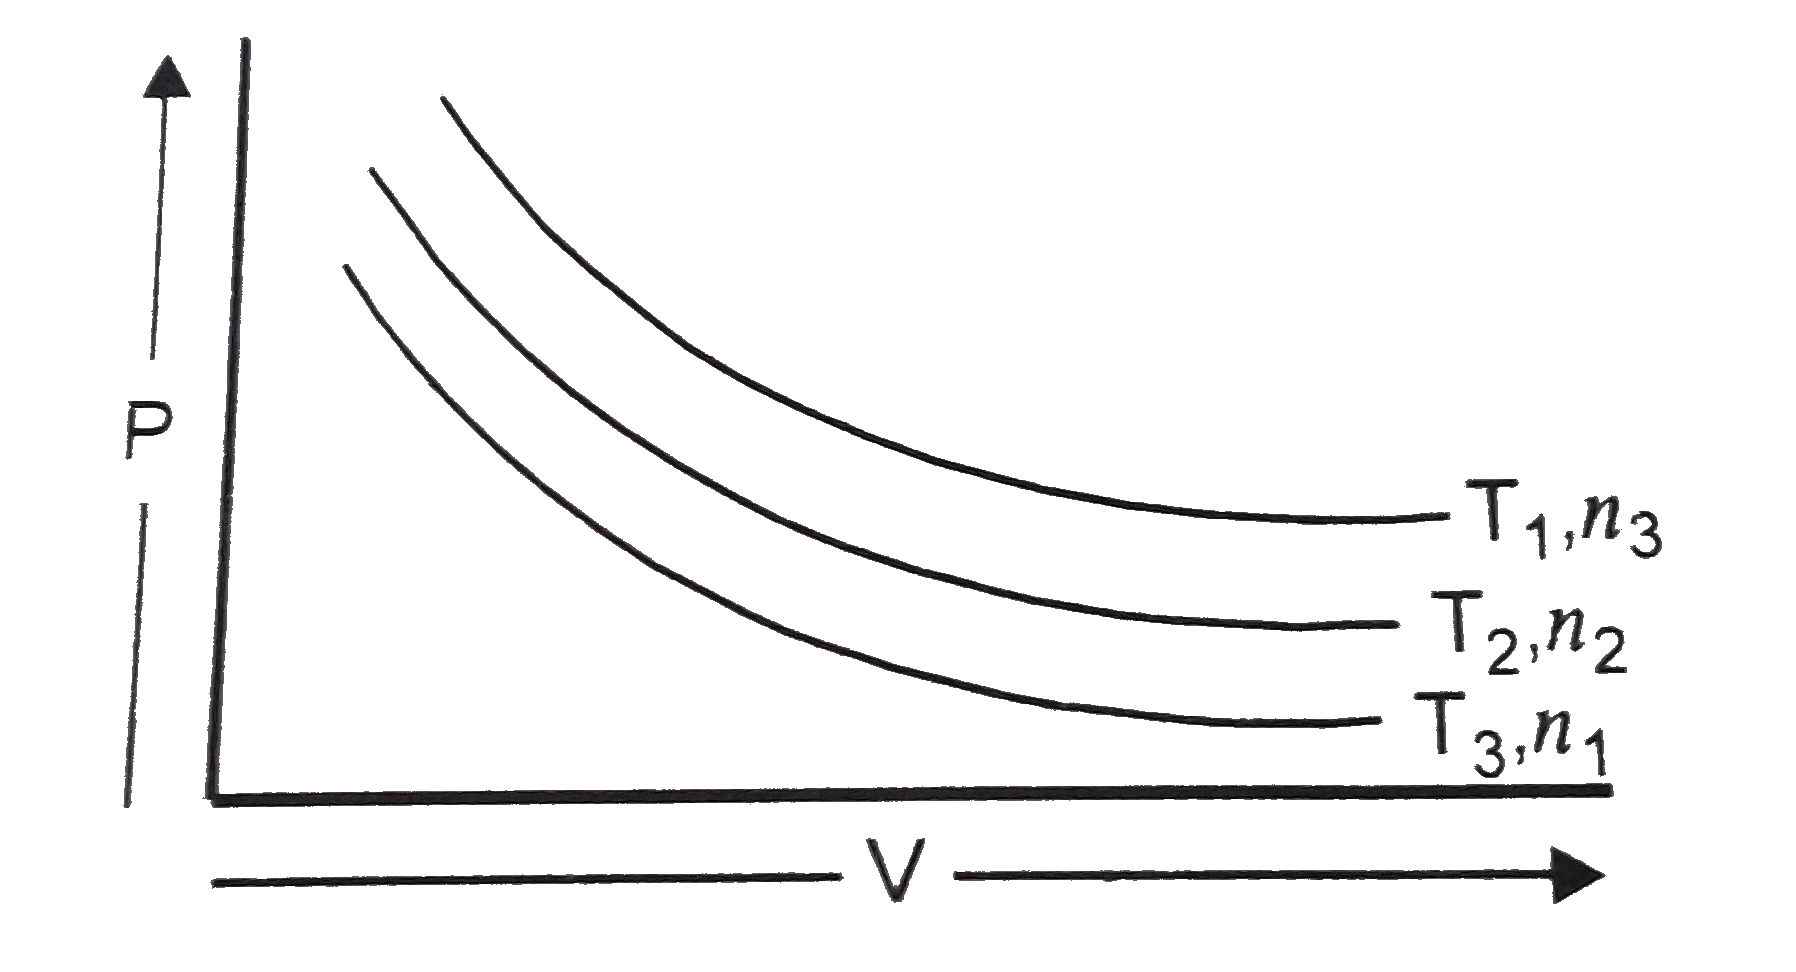
- The graph of P vs V is given at temperature and number of moles : ...
Text Solution
|
- Draw a graph of log P vs log (1/V) for a fixed amount of a gas at cons...
Text Solution
|
- The graph of P vs V is given at temperature and number of moles : The ...
Text Solution
|
- At constant temperature of 273 K, (1)/(V) vs P are plotted for two ide...
Text Solution
|
- In the P vs V graph of CO(2) gas given below, account for the reduct...
Text Solution
|
- The correct graph regarding v vs KE. ( Incident)
Text Solution
|
- कौन-सा ग्राफ रेखीय होगा ? P vs. V अथवा P vs. (1)/(V)
Text Solution
|
- P vs. V तथा P vs. (1)/(V) के ग्राफो की प्रकृति बताइए |
Text Solution
|
- Will the nature of the following graphical presentations for a given m...
Text Solution
|