A
B
C
D
Text Solution
Verified by Experts
The correct Answer is:


Topper's Solved these Questions
Similar Questions
Explore conceptually related problems
DINESH PUBLICATION ENGLISH-MOLECULES OF THE CELL-RQ
- Richest source of protein is
Text Solution
|
- Which set is correctly matched ?
Text Solution
|
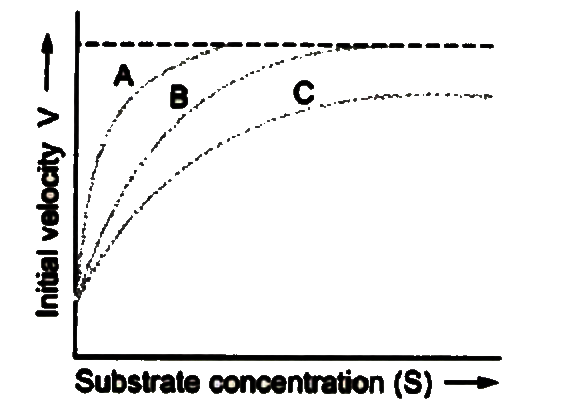
- The figure given below shows three velocity substrate concentration cu...
Text Solution
|
- Match the items in colour I with items in column II and choose the cor...
Text Solution
|
- Allosteric modulation is due to inhibition of coenzyme action by
Text Solution
|
- Name the most abundant elements which occur in nucleic acid macromole...
Text Solution
|
- Pentoses and hexoses are the most common Or The simple polyhydroxy...
Text Solution
|
- Phospholipids are important components of cell membranes because they
Text Solution
|
- Wax is
Text Solution
|
- Non-protein part of enzyme is called
Text Solution
|
- Match the column : {:(,,"ColumnI","","ColumnII"),(,a,"Biological pig...
Text Solution
|
- Given below is the chemical formula of CH3(CH2)14-overset(O)overset(||...
Text Solution
|
- Which is mismatched ?
Text Solution
|
- Which one is water soluble vitamin ?
Text Solution
|
- Select the wrong statement wrt the biomolecules
Text Solution
|
- Match the following with correct combination |{:("Column - I","Colum...
Text Solution
|
- In a protein, amino acids are linked by
Text Solution
|
- NAD is
Text Solution
|
- H(2)N-underset(R )underset(|)overset(H)overset(|)C-COOH is general for...
Text Solution
|
- Prostaglandin is
Text Solution
|